
 Community
 Video Library
 Agent Training
 Freshservice
 Freshdesk
 Freshchat
 Freshcaller
 Freshsales
 Freshteam
 Freshworks Neo
 Freshsurvey
 Freshservice for MSP
 Freshservice lets you visualize rack layouts, manage device placement, and analyze physical and logical dependencies across your infrastructure using impact charts.
This article describes how to work with rack layouts, connections, and dependency views.
TABLE OF CONTENTS
Prerequisites
You need the following before visualizing racks:
Access to the Racks module in your Freshservice instance.
Rack records created in your Freshservice instance.
View rack layout
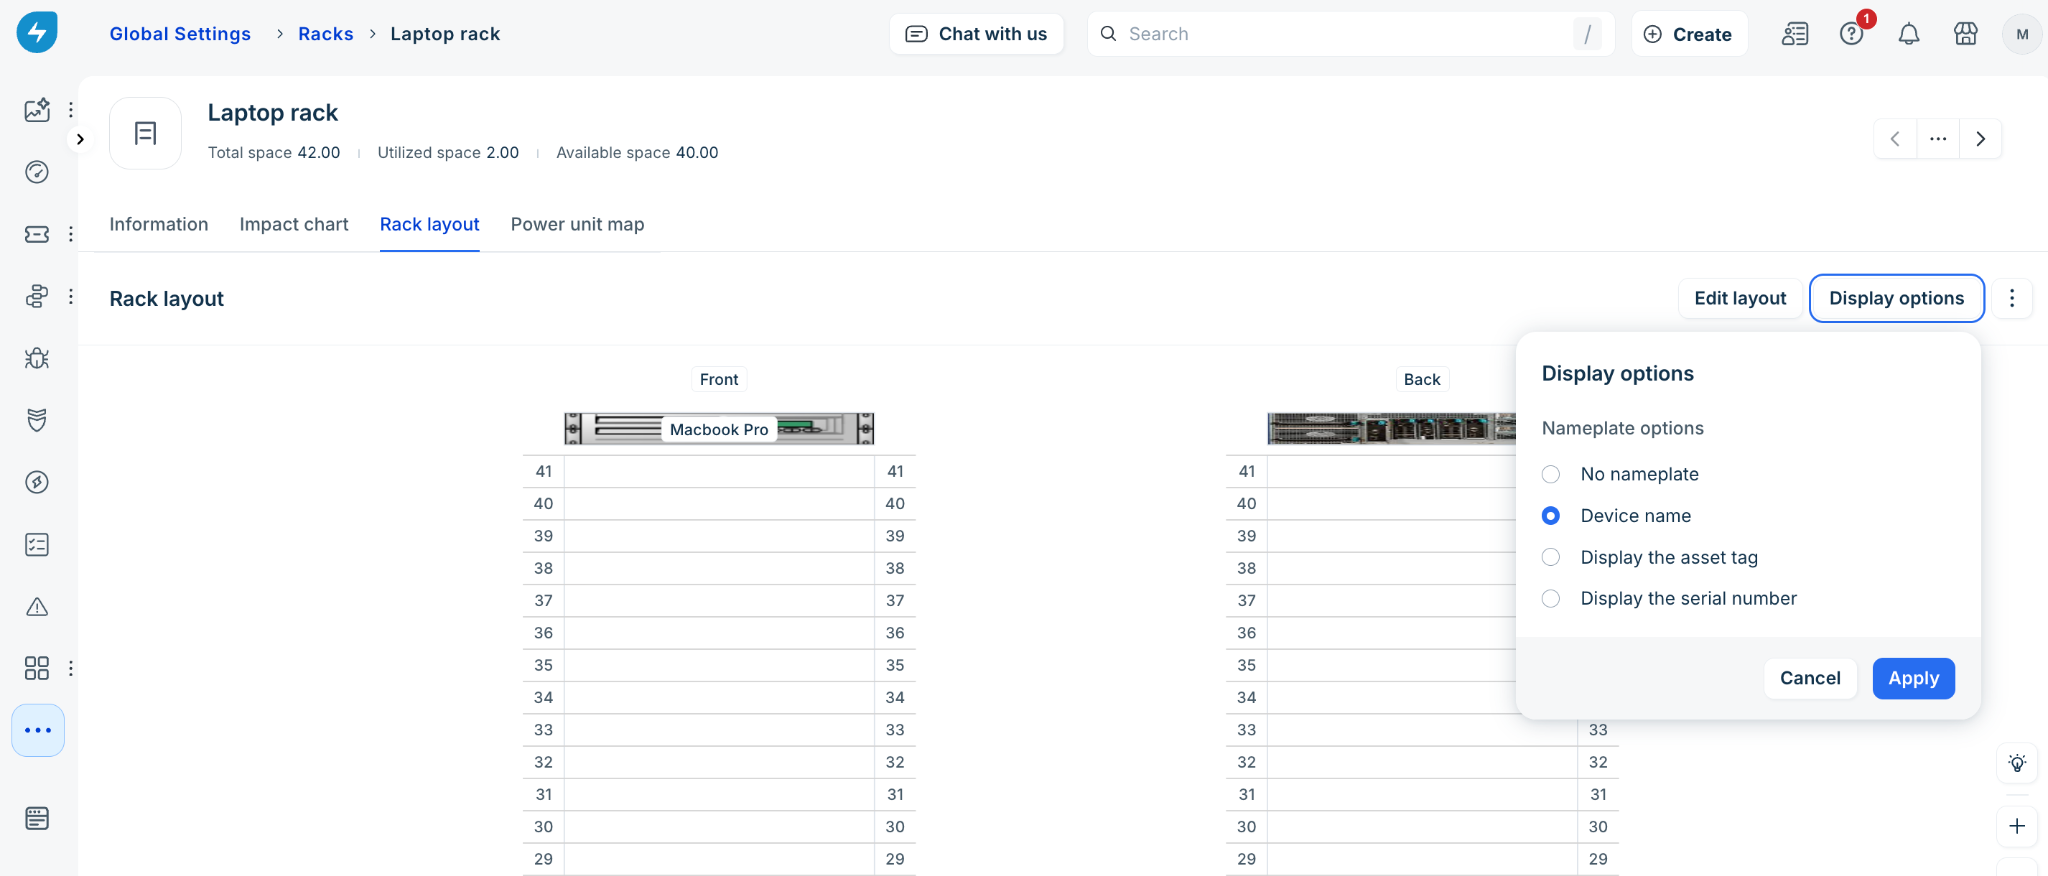
The Rack layout tab provides a detailed visual representation of a specific rack's configuration, showing both the "Front" and "Back" elevations. It allows users to see exactly where devices, assets, or power units are physically mounted within the numbered Rack Units (U).
To view a rack layout, follow these steps:
Go to the Racks list and open the rack record.
Go to the Rack Layout tab.
On the right side of the Rack layout page, there are several controls to modify and export the visual layout.
Edit layout
Clicking the Edit layout button allows you to make changes to the physical arrangement of the devices, assets, or power units within the rack.
Display options
Clicking the Display options button opens a configuration menu specifically for nameplate options. This allows you to customize the labels overlaid on the devices, assets, or power units in the visual diagram. You can choose one of the following options and click Apply to save your changes:
No nameplate
Device name
Display the asset tag
Display the serial number
Additional actions (Download layout)
Clicking the vertical ellipsis (⋮) icon next to the Display options button opens a dropdown menu containing a Download layout option. This allows you to export and save a copy of the visual rack diagram.
View physical connections
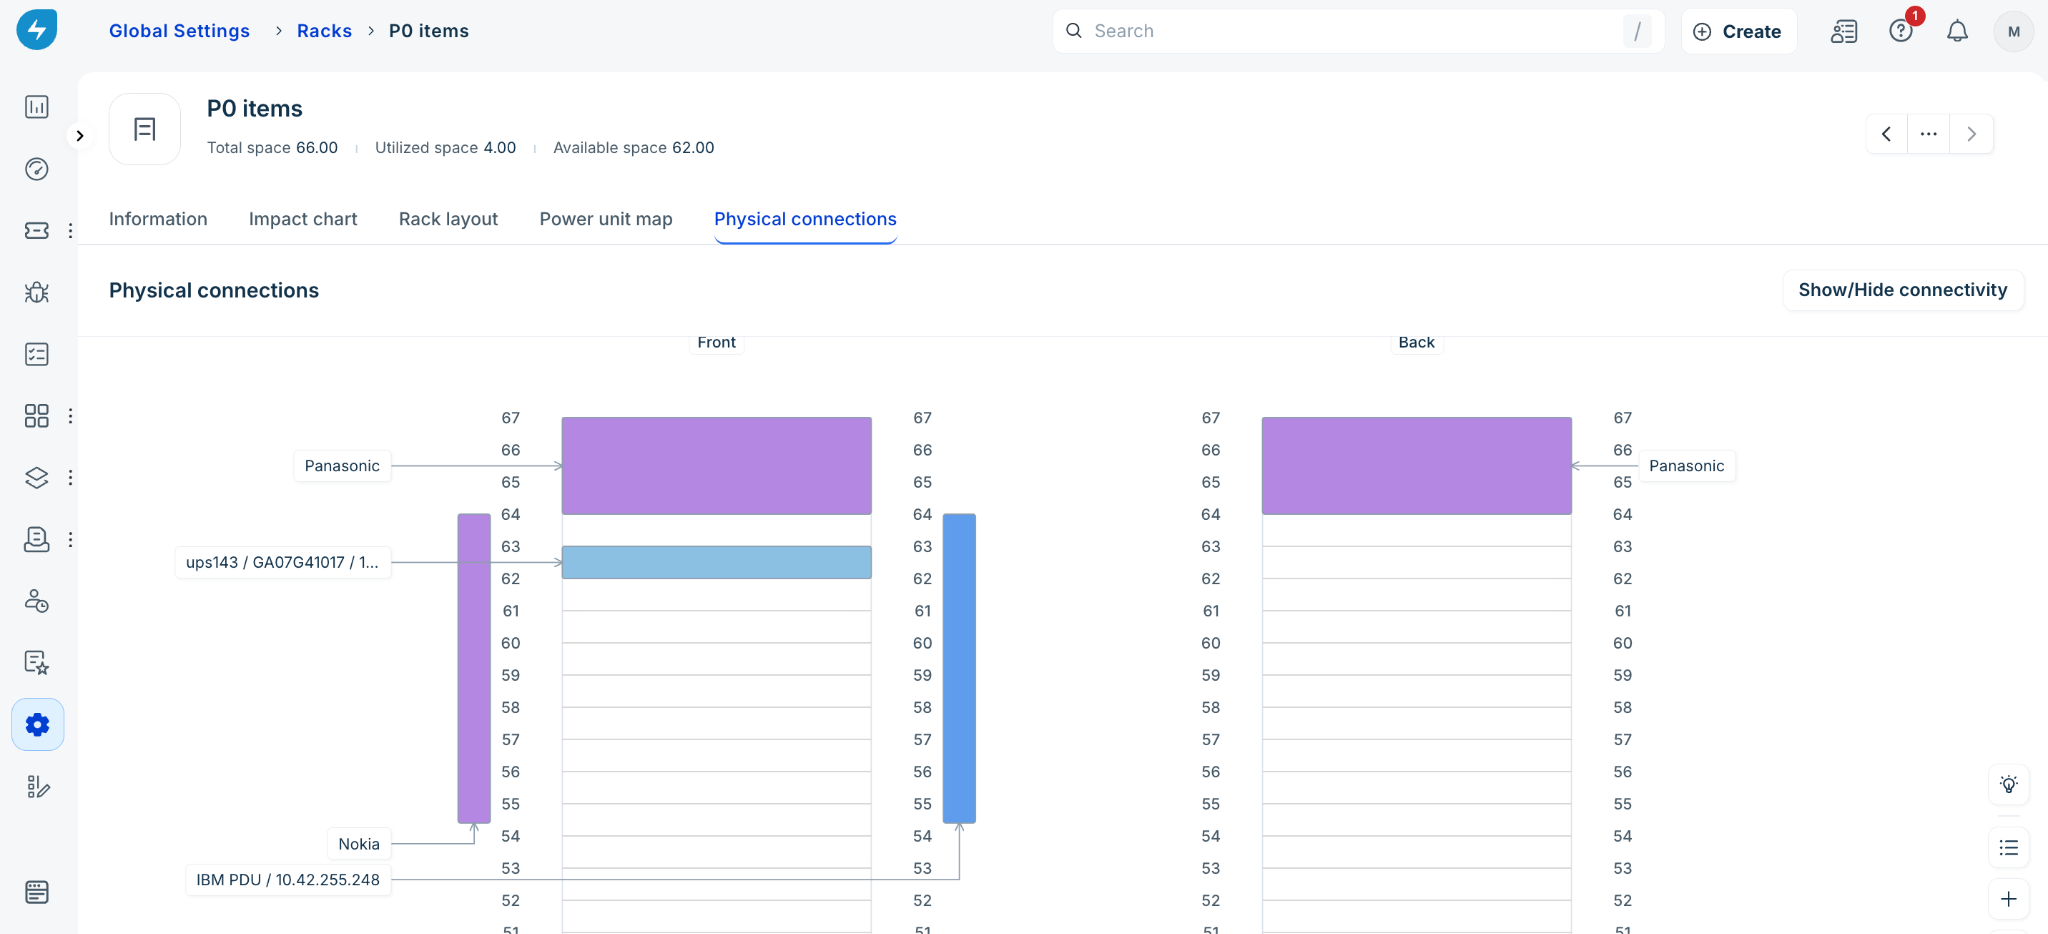
The Physical connections tab provides a visual mapping interface that illustrates how devices are cabled and connected within a specific rack. Similar to the Rack Layout, it presents both a "Front" and "Back" perspective alongside the numbered rack units (U).
To view the Physical connections tab, follow these steps:
Go to the Racks list and open the rack record.
Go to the Physical connections tab.
Visualize connections
The main diagram acts as a topology map, displaying directional arrows that represent physical cables linking external assets (such as a connected laptop) directly to the specific hardware components mounted within the rack's slots.
View details of connections
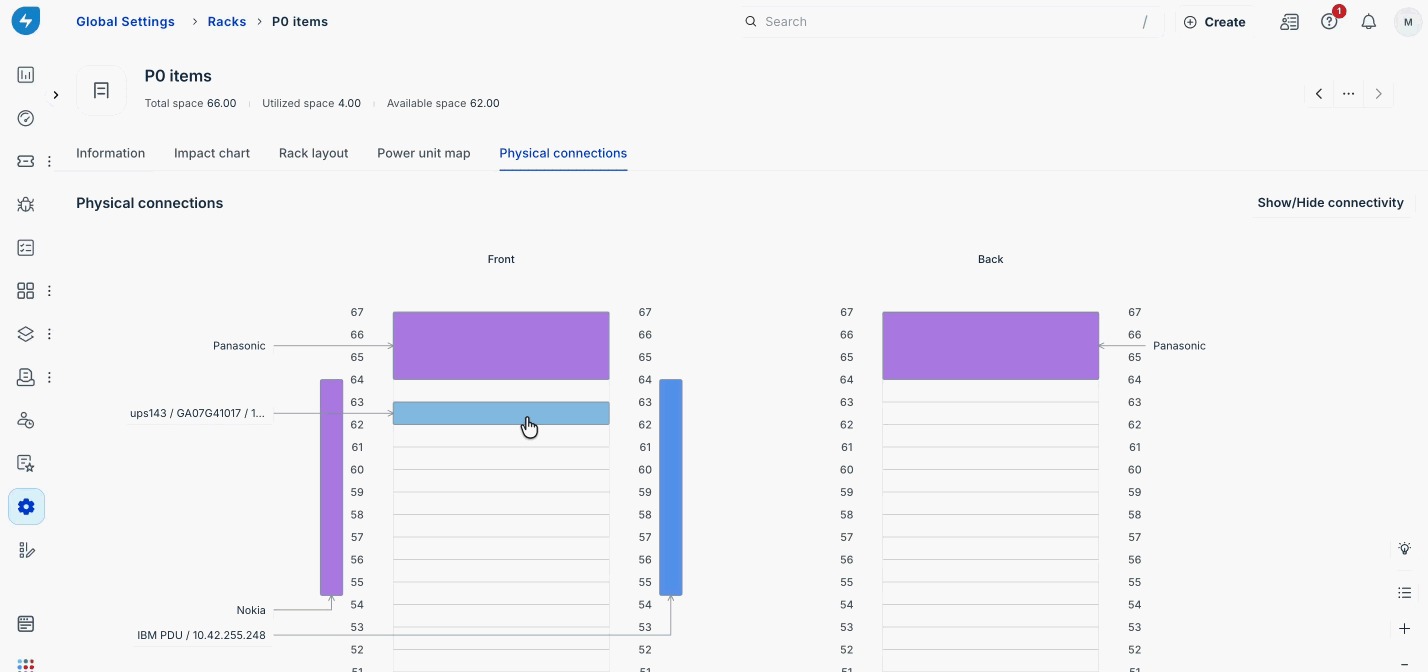
By interacting with the visual map, you can instantly pull up specific information about any connected equipment. Clicking on a device node opens a slide-out panel on the right side of the screen. This panel displays information about the device, asset, or power unit.
Filter the connection map
You can customize the complexity of the diagram by filtering which types of physical links are visible.
In the Physical connections tab of a rack, click the Show/Hide connectivity button located on the top right side of the page.
A configuration menu appears with checkbox options allowing you to toggle specific connection types:
Network connections: Check this box to overlay network cables onto the diagram.
Power connections: Check this box to overlay power cables onto the diagram.
Click the Apply button to update the visual map with your selected filters, or click Cancel to close the menu without making any changes.
View power unit map
The power unit map provides a detailed, interactive topological diagram of the power distribution within a specific rack. It visualizes the hierarchy and connections between Power Distribution Units (PDUs) and their individual power ports
To view a power unit map of a rack, follow these steps:
Go to the Racks list and open the rack record.
Go to the Power unit map tab.
The existing power unit associated with the rack is displayed.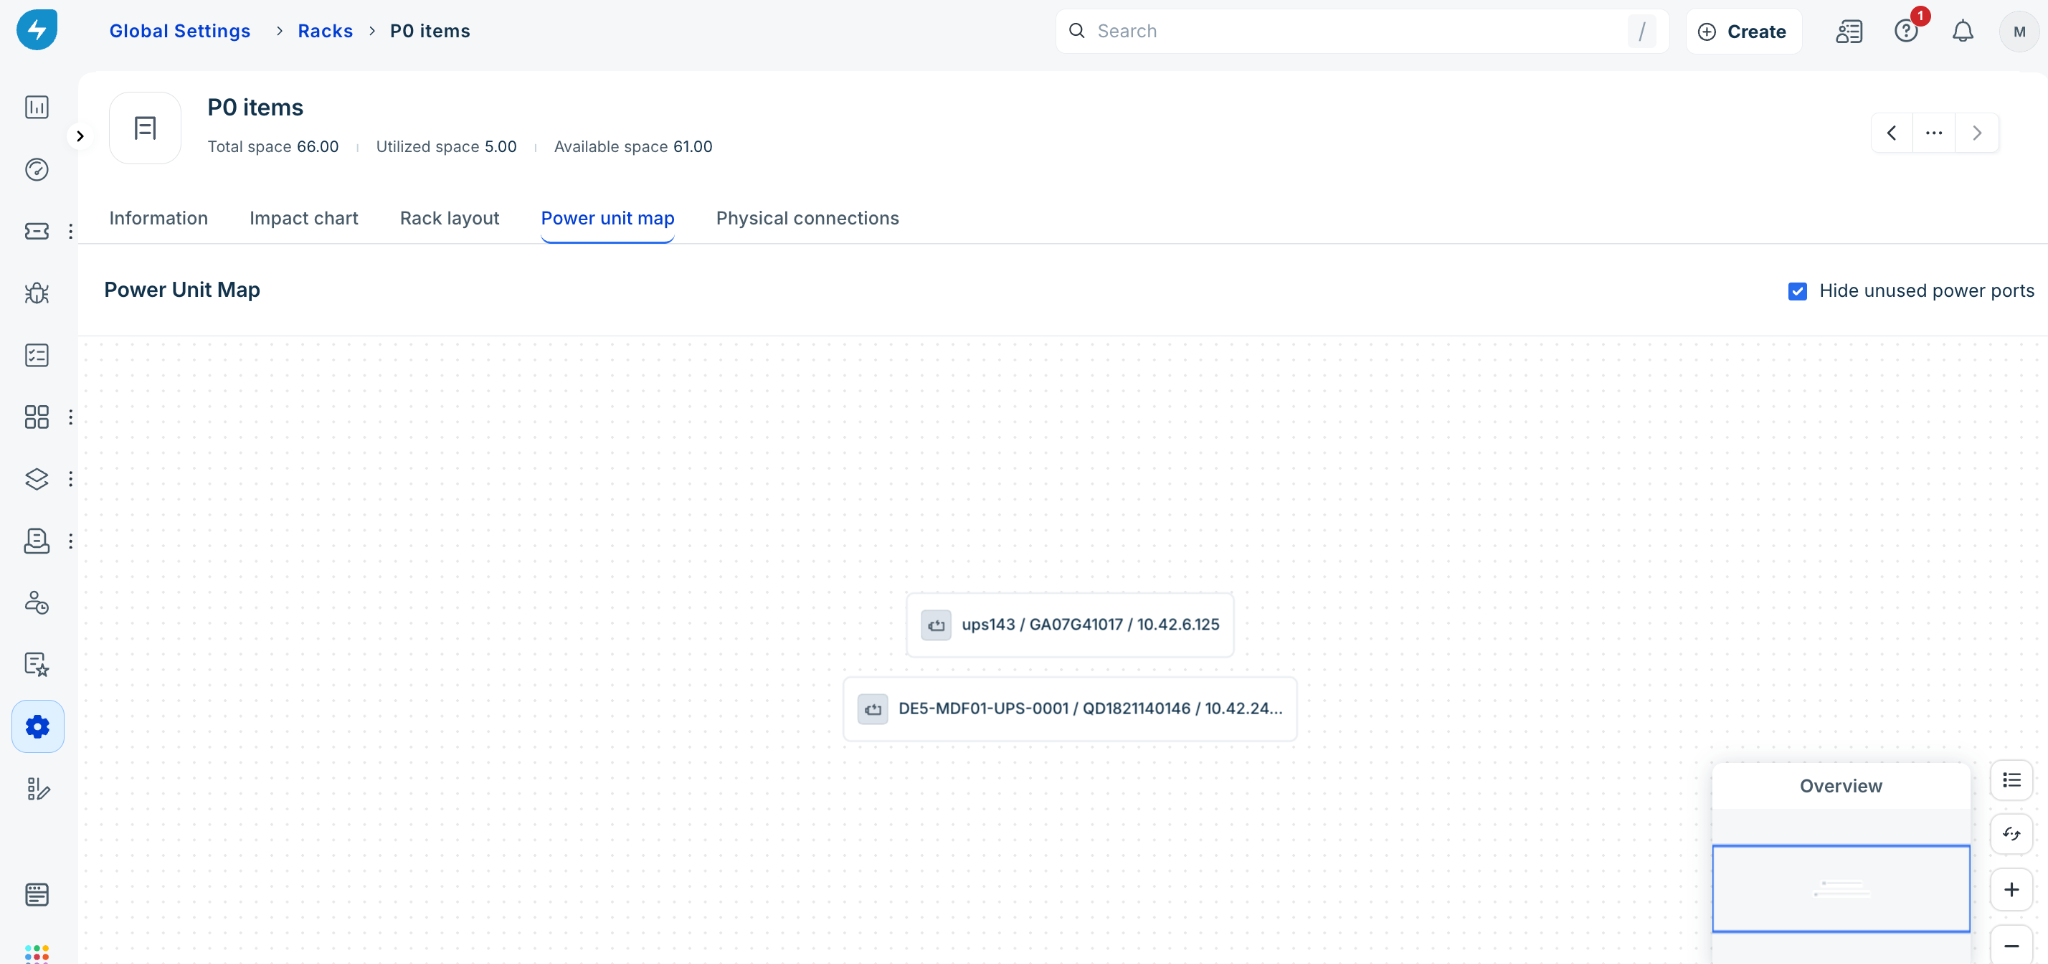
You can click on individual nodes within the topological diagram to view specific details about that component.
Filter the view
To help declutter the visual map, you can toggle the visibility of inactive connections using the Hide unused power ports checkbox located in the top right corner of the page.
If unchecked: The map will display all physical ports on the PDU, mapping out nodes regardless of whether a device is currently drawing power from them.
If checked: The map will collapse and hide any ports that are not actively connected or utilized, leaving only the primary PDU nodes and active links visible.
View impact chart
The impact chart displays a node-based visual diagram that illustrates the dependencies and relationships between a selected rack and its connected infrastructure components.
To view the impact chart of a rack, follow these steps:
Go to the Racks list and open the rack record.
Go to the Impact chart tab.
Navigate the chart
Use the following controls to view and interact with the dependency diagram:
View dependencies: The main canvas displays interactive nodes connected by directional arrows. These arrows map out relationships, such as an external power unit linking directly to the main rack.
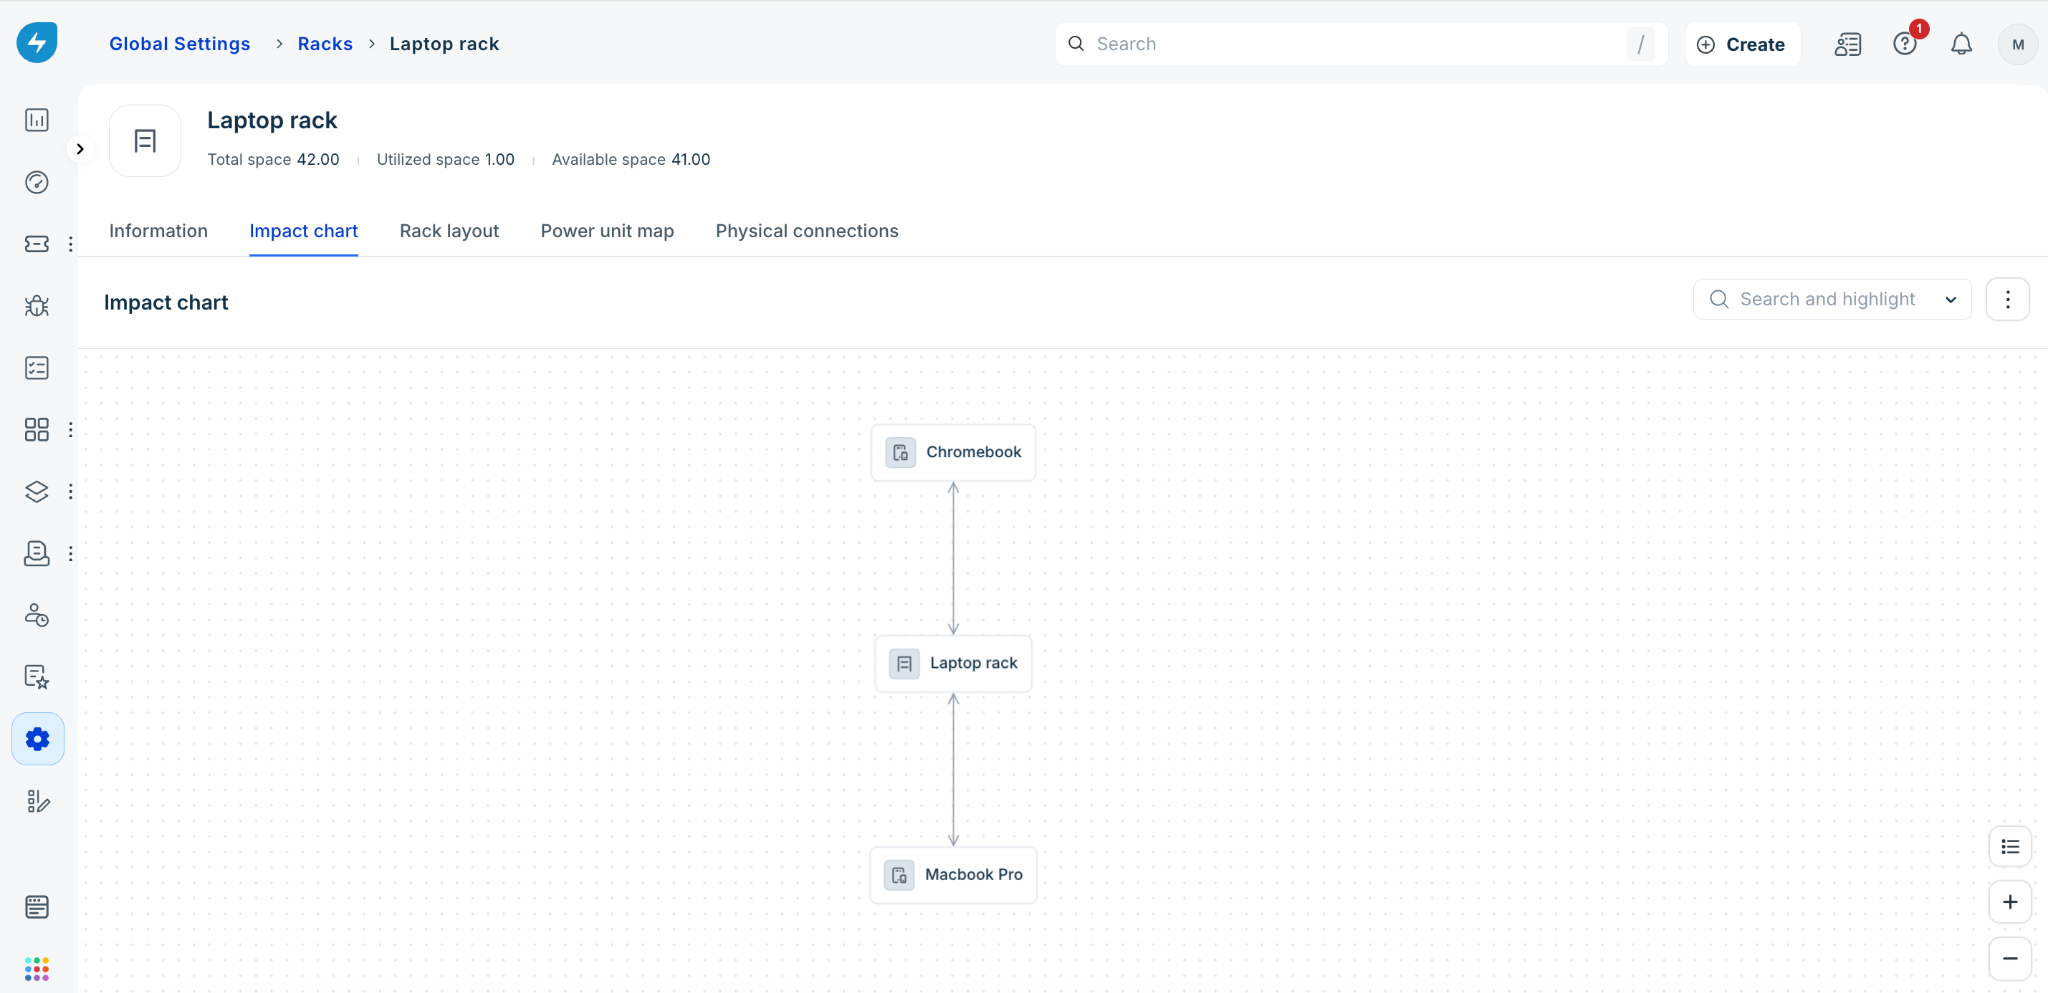
Search and highlight: To quickly find and emphasize specific nodes in complex diagrams, enter a node name in the Search and highlight box in the upper-right corner of the chart area.
Zoom: Adjust your view by using the zoom controls (+ and -) located in the lower-right corner of the canvas.
Export the impact chart
You can save a snapshot of the current dependency diagram to your local device.
To export the chart, follow these steps:
Click the More options (⋮) menu in the upper-right corner, next to the search box.
Select Create Image.
In the Download Image pane, select an export format (PNG or SVG).
Click Download to save the file, or select Cancel to close the menu without exporting.