Note: Available only for new signups after the 31 March, 2026 release. If you signed up earlier, refer to the existing ITAM documentation.
Freshservice Analytics allows you to transform raw software data into actionable insights. By creating specialized reports, you can monitor software usage, track license compliance, and optimize your SaaS spend.
This article provides instructions on how to generate reports for software data using the Analytics module. It covers viewing curated reports, creating reports from scratch and, using pre-built widgets from the gallery to visualize software metrics.
Prerequisites
You need the following before you begin:
Administrator or supervisor permissions to access the Analytics module.
Active software data populated in the IT Asset Management > Software module.
View curated reports
Curated reports in Freshservice Analytics are pre-configured, out-of-the-box dashboards designed to provide instant insights into several modules. To view curated reports for software, follow these steps:
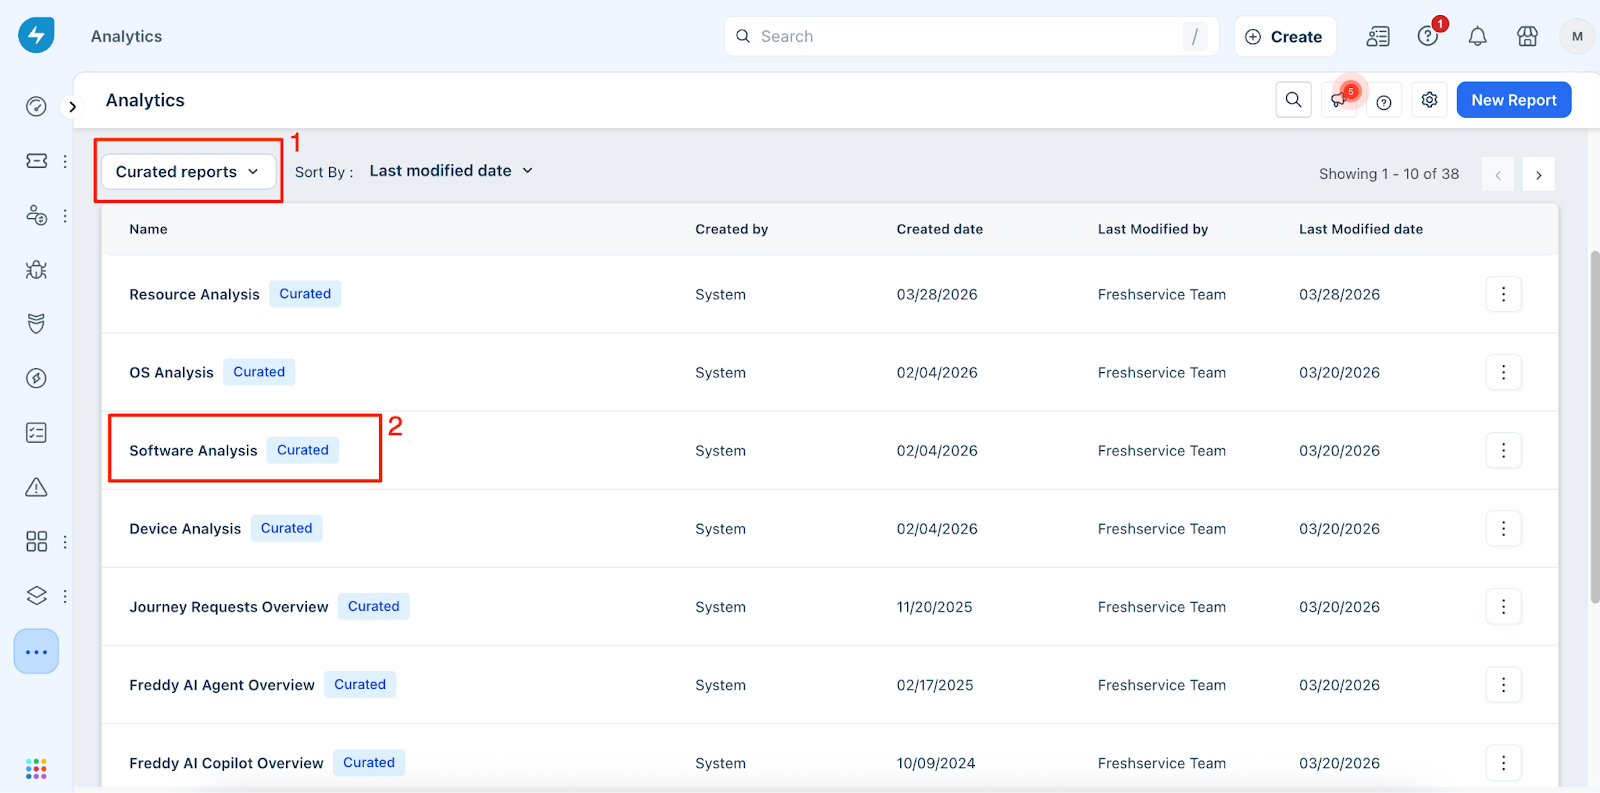
Go to Reporting > Analytics.
On the Analytics page, select Curated reports from the dropdown menu at the top left and select Software analysis from the list.
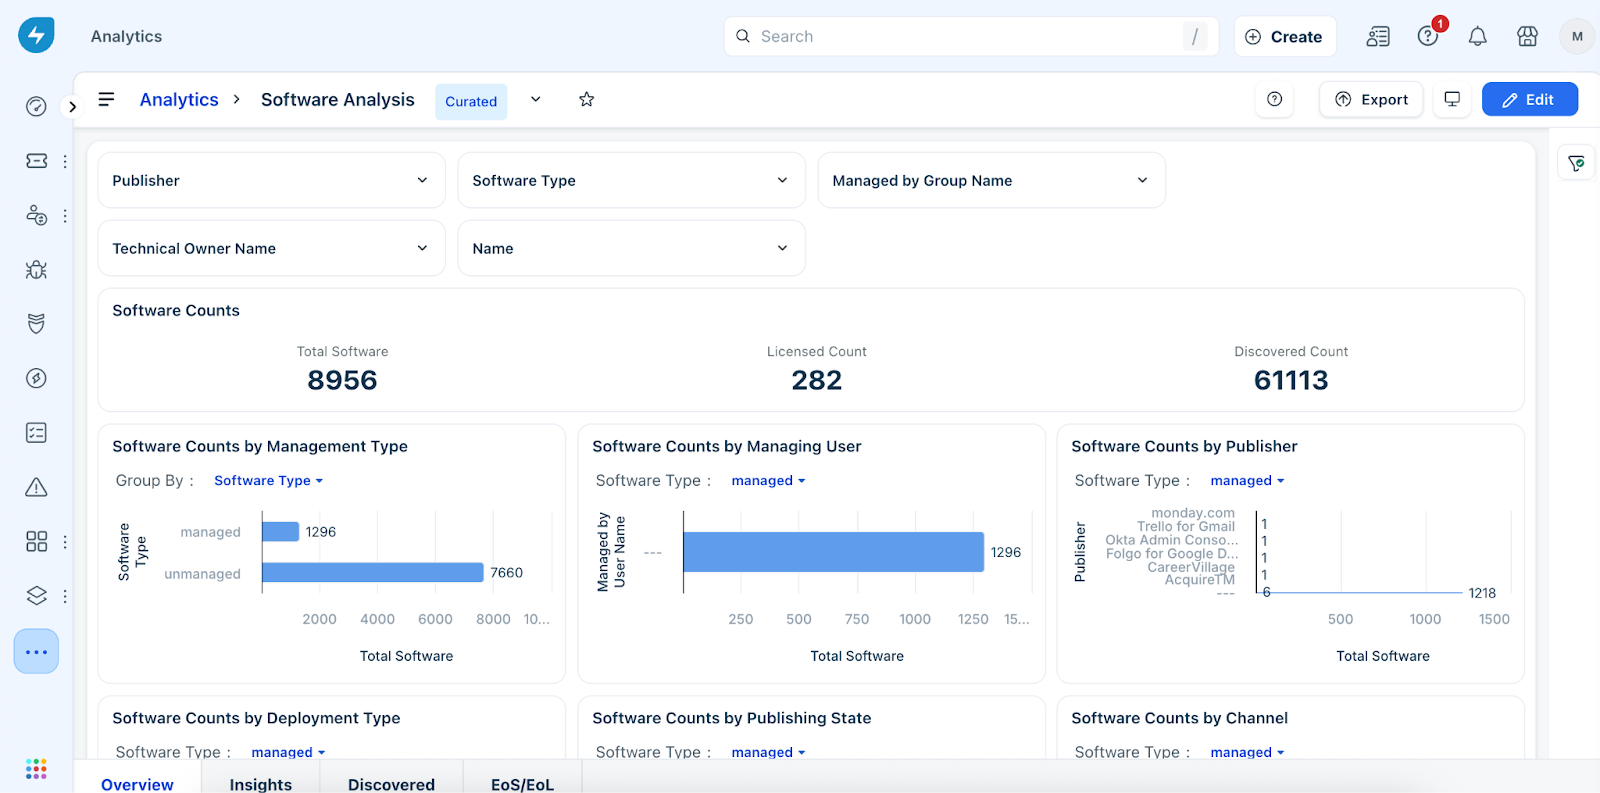
Review the report listing several parameters related to the software module.
Use filters such as Publisher or Software Type to filter out the results.
To edit the report, click Edit, make the necessary changes, and click Save.
Create software reports
To generate reports and visualize software data, follow these steps:
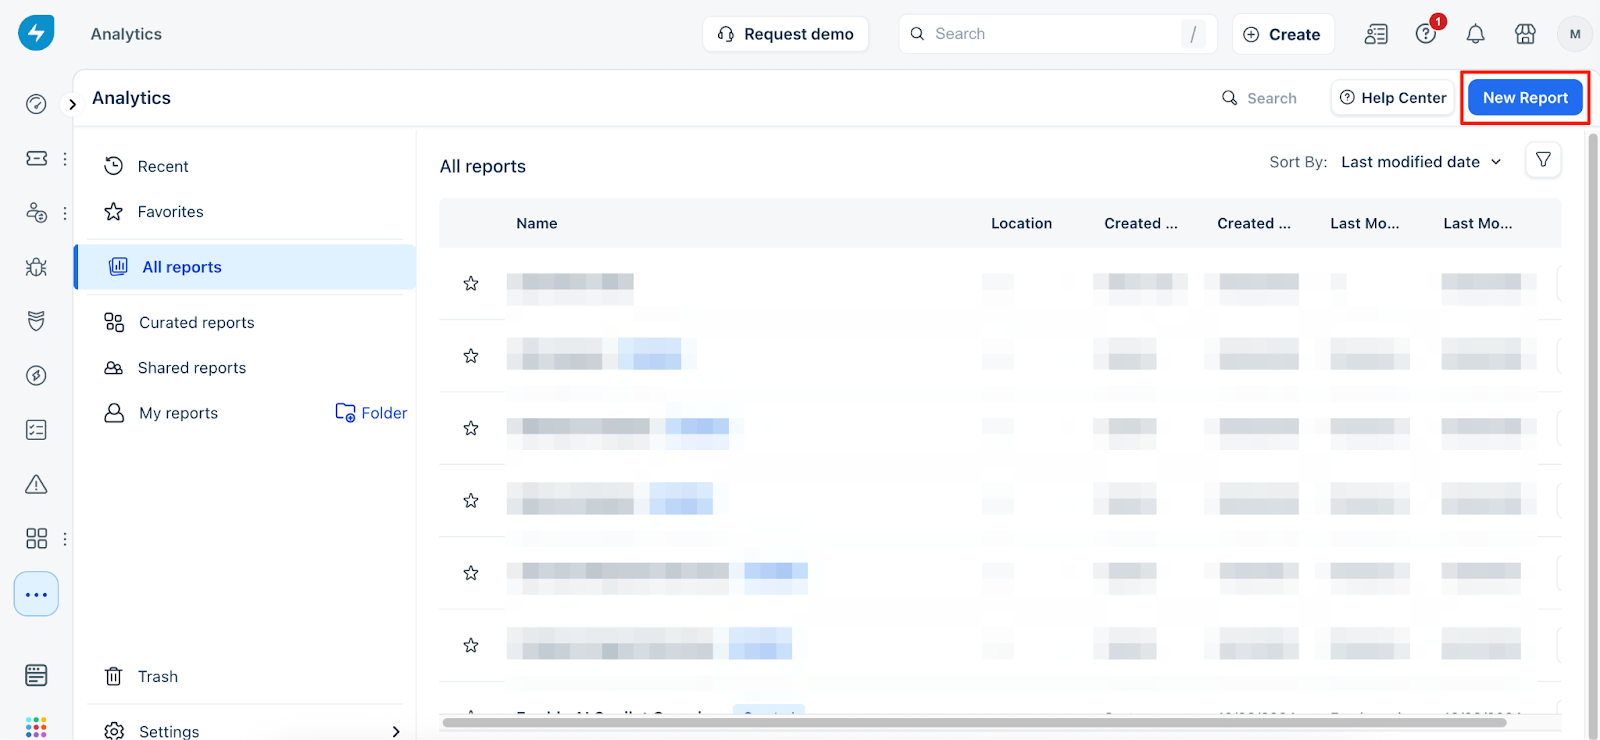
Go to Reporting > Analytics and click New Report.
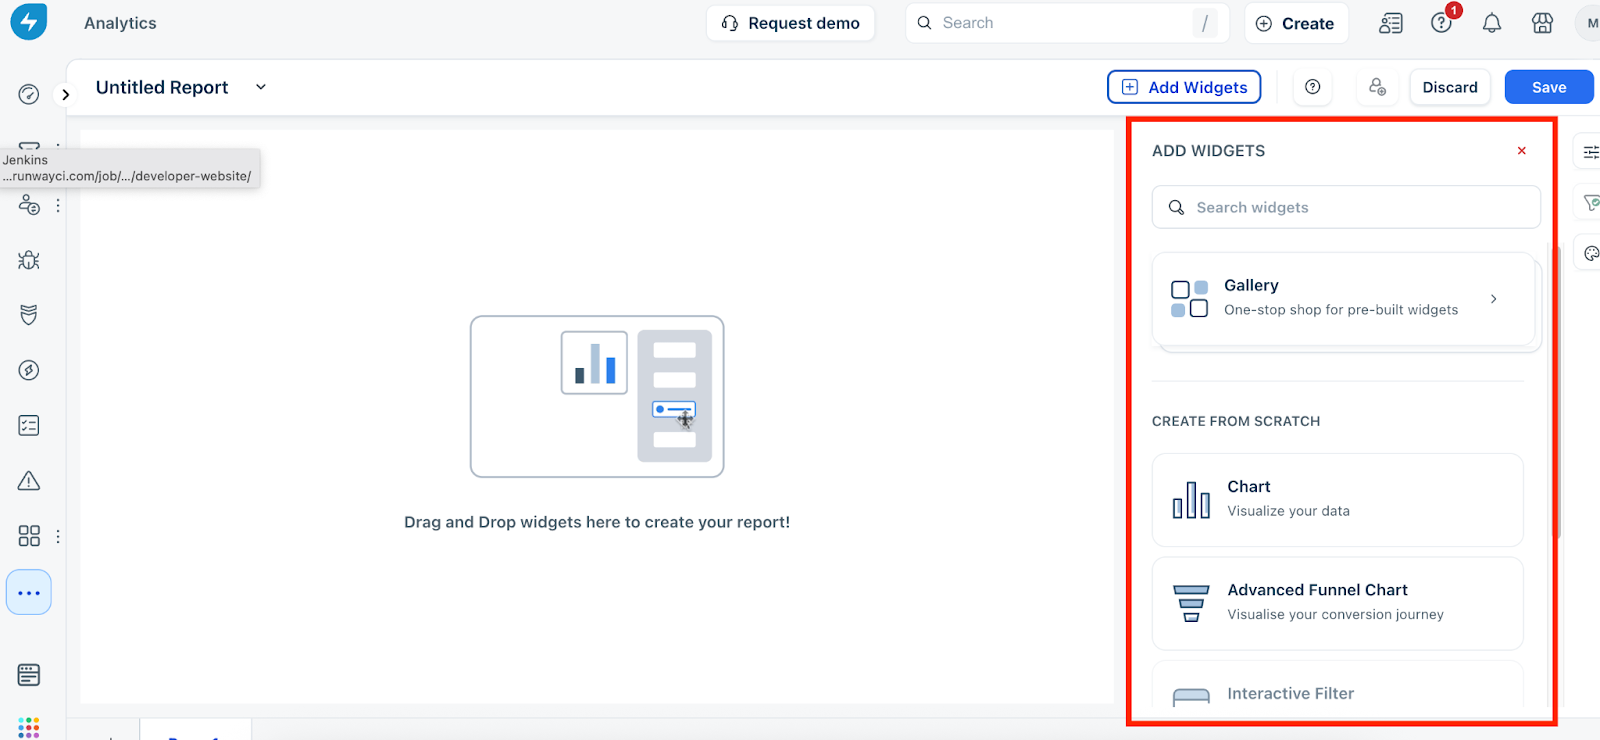
On the report page, click Add Widgets to begin adding data visualizations.
Choose one of the following methods to add data to your report:
Build a custom widget from scratch: Drag the desired widget type from the Create From Scratch section onto the canvas. Select your specific metrics and click Apply.
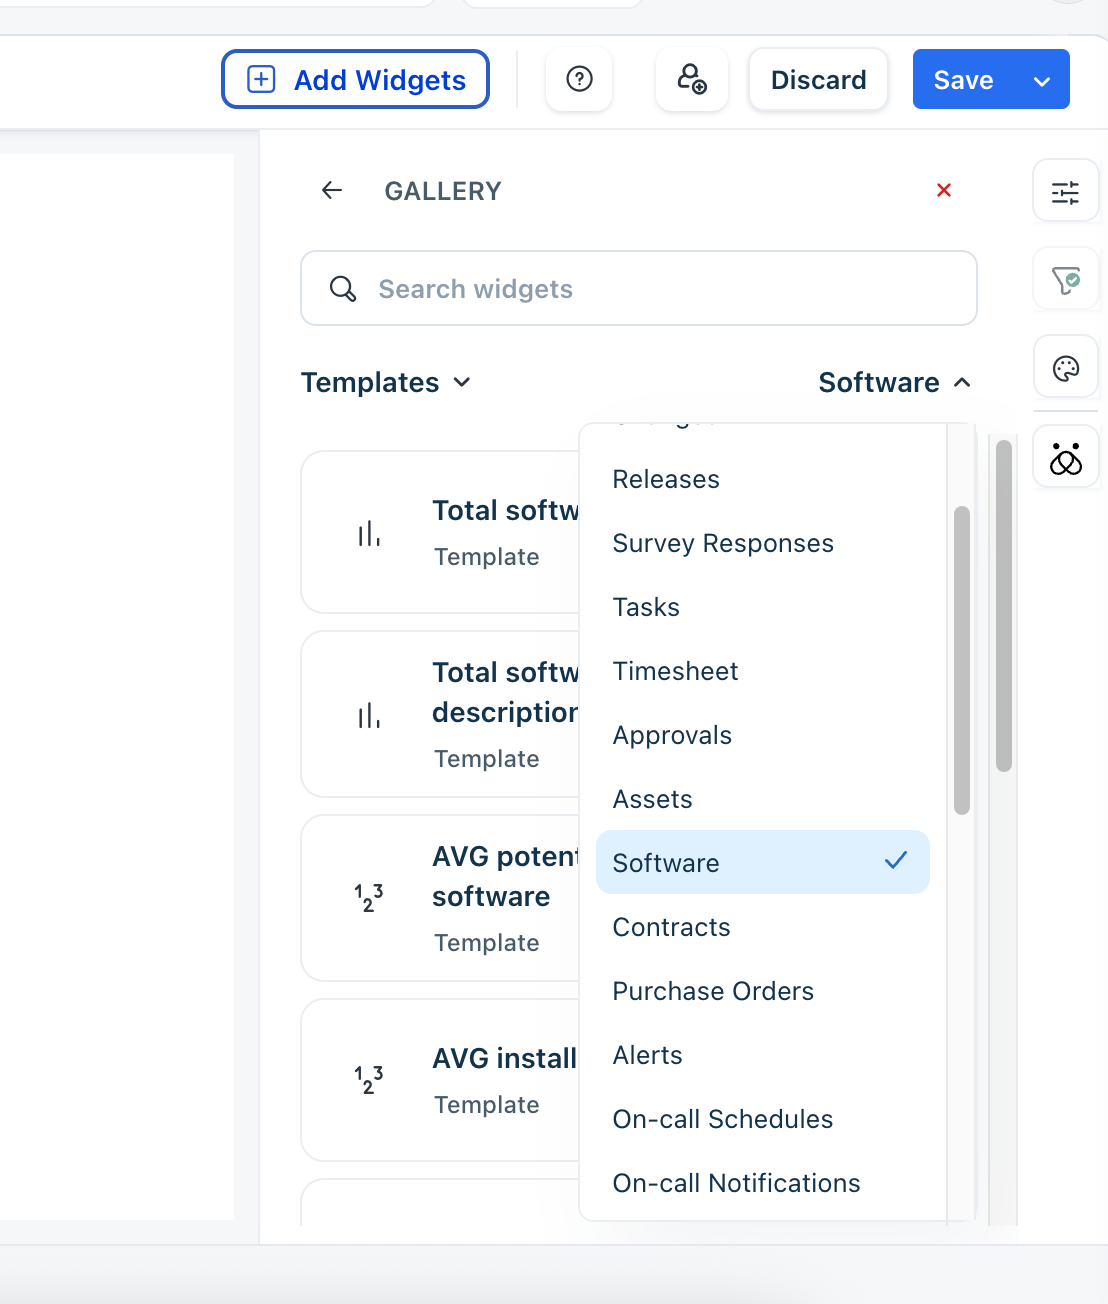
Use pre-built gallery options: Click Gallery and select Software from the dropdown menu to view a list of predefined widgets.
Drag and drop the required widgets from the Software module list directly onto the analytics page.
Click Save to save the report.
The new software report is now available in your Analytics list for viewing.