 Community
 Video Library
 Agent Training
 Freshservice
 Freshdesk
 Freshchat
 Freshcaller
 Freshsales
 Freshteam
 Freshworks Neo
 Freshsurvey
 Freshservice for MSP
 TABLE OF CONTENTS
Use Rank Order to identify high and low performers based on the business impact of a metric.
Overview
Rank Order helps you identify highest and lowest performing agents in your reports. It helps you analyze whether an increase in a metric is positive or negative and displays results based on the metric's business impact. The following use cases describe how Rank Order works for different metric types:
- Metrics where higher values indicate better performance, such as CSAT (customer satisfaction score) and resolution compliance, display the highest values when you select Top values and the lowest values when you select Bottom values in the chart.
- Metrics where lower values indicate better performance, such as first response time and resolution time, display the lowest values when you select Top values and the highest values when you select Bottom values.
- Metrics related to workload, such as total tickets or open ticket count, are read as lower values as better outcomes.
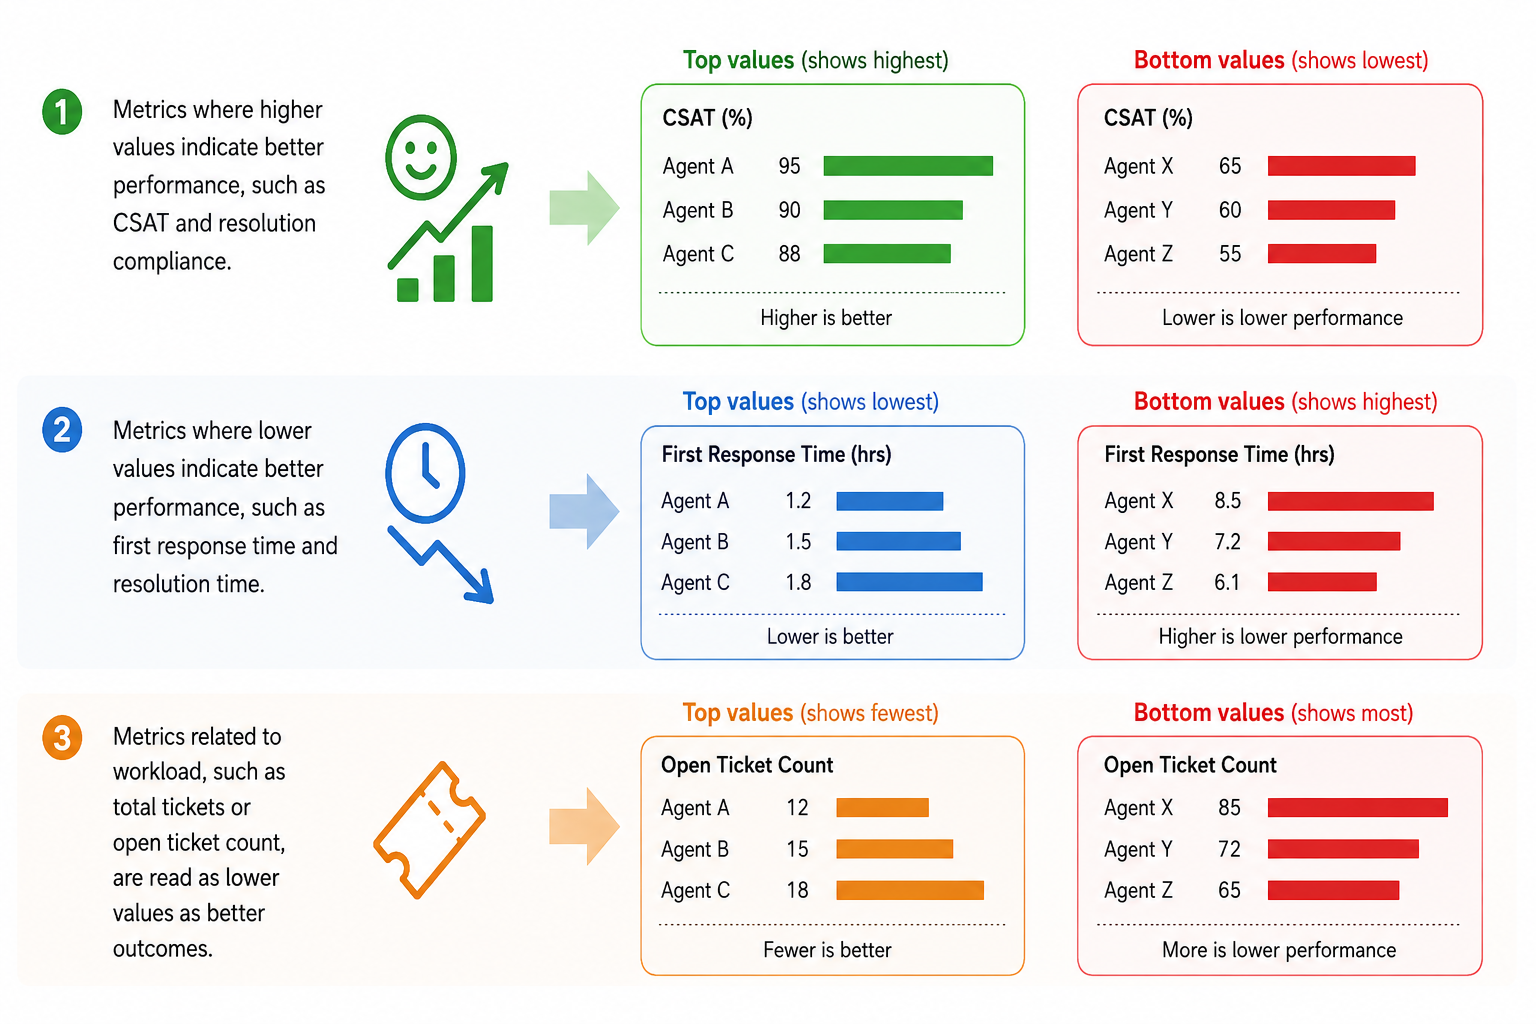
The following examples show how Rank Order works with Analytics reporting and Analytics embedded charts, including Executive Overview dashboard.
View top agents by Open tickets on Executive Overview dashboard
Use Rank order to identify top-performing agents based on open tickets.
Prerequisite: Ensure you have Executive Insights access. For more details, see Freddy AI Executive Insights
Follow these steps to view the top performing agents by Open tickets:
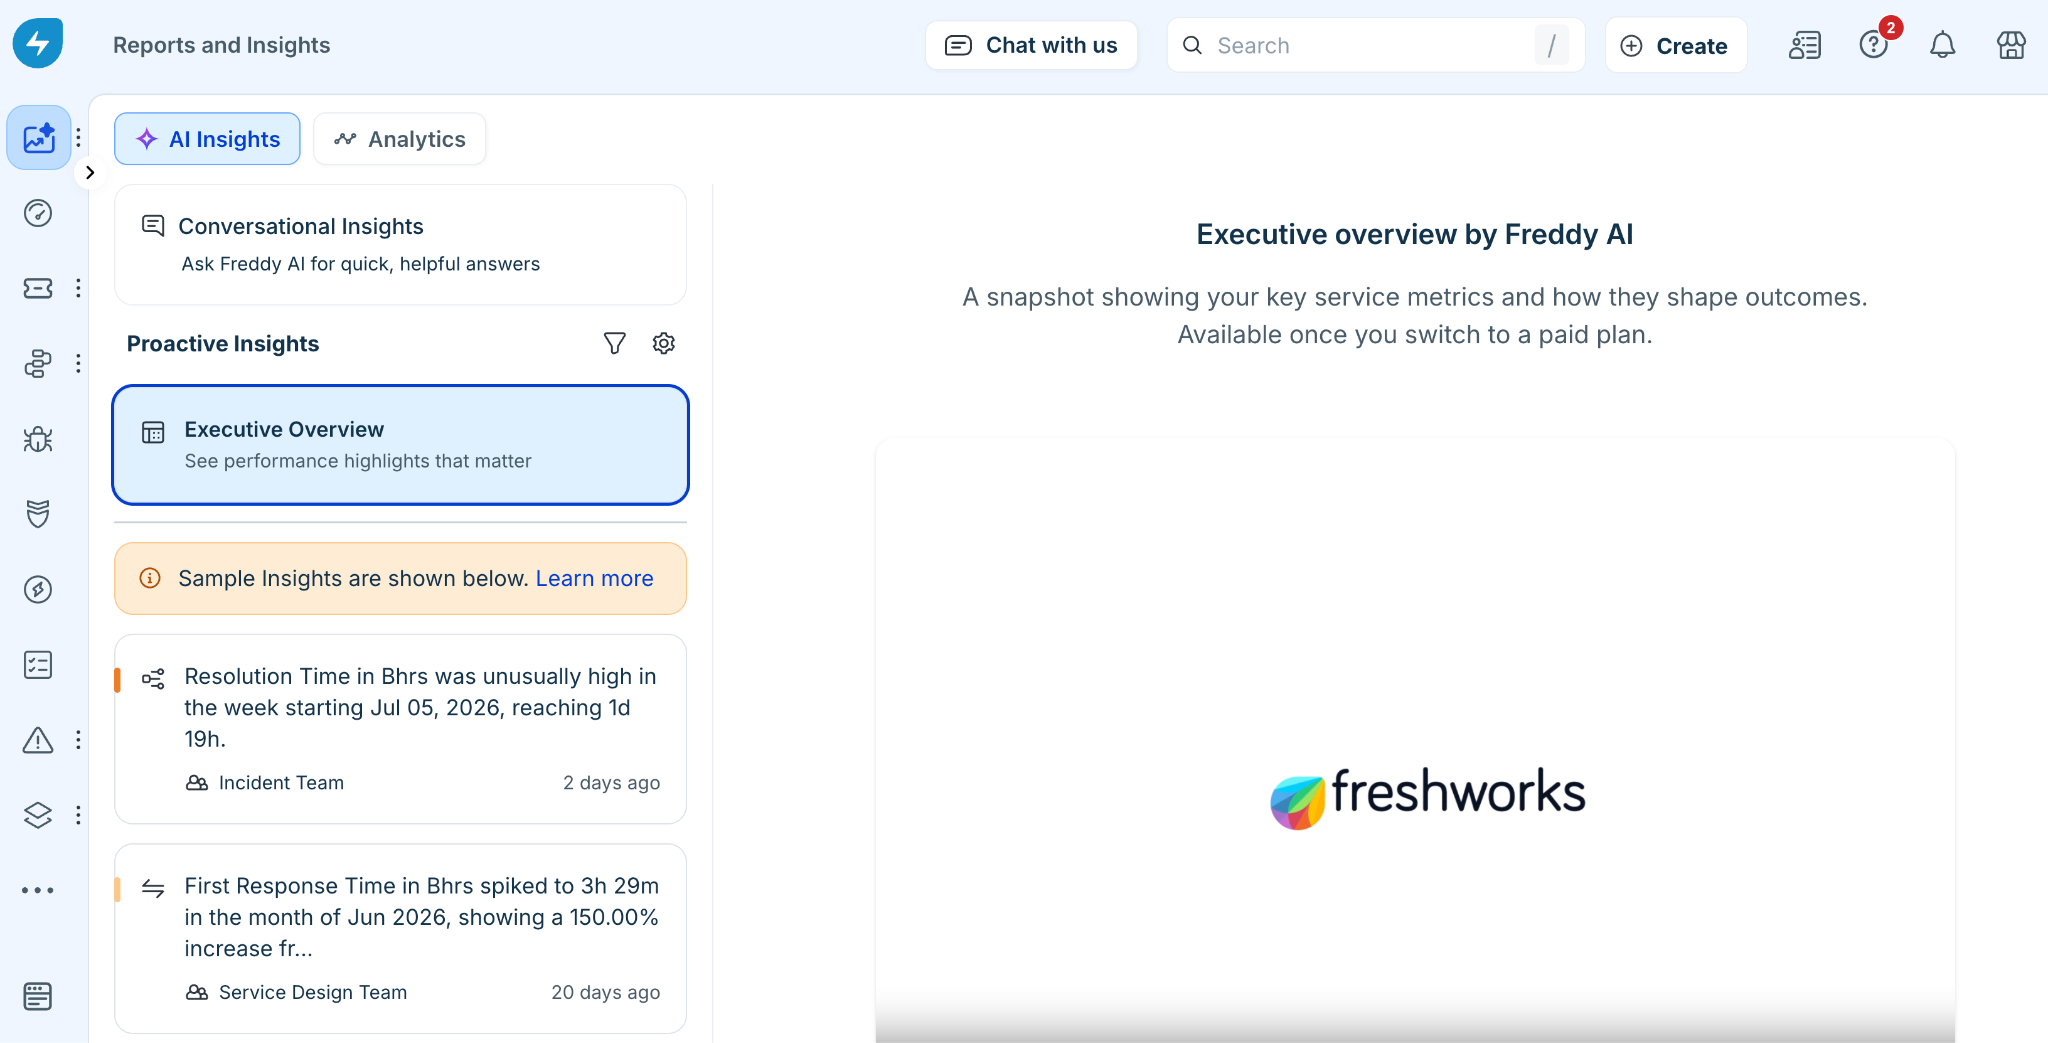
Go to Freshservice and navigate to AI Insights > Executive Overview.
Scroll down to the Metric Overview section and select Open Tickets from the drop down.
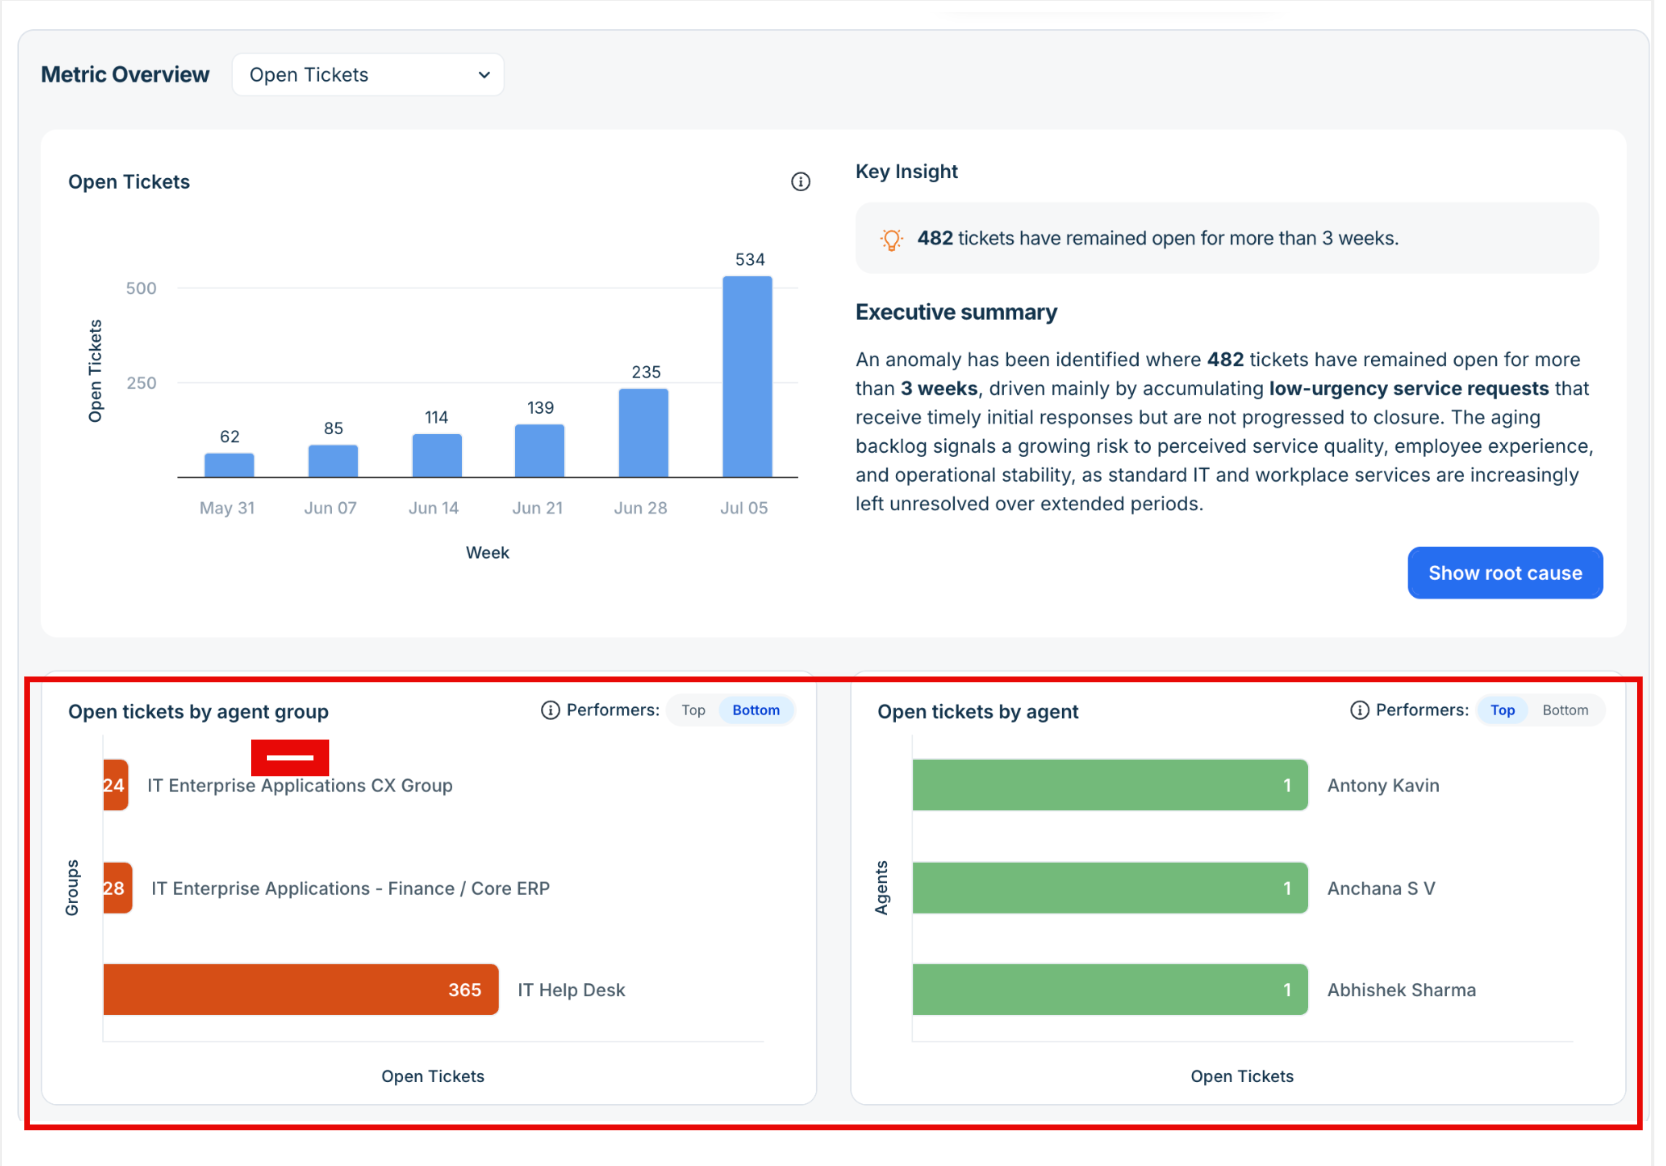
Open tickets by agent groups and Open tickets by agents cards are displayed to show how agent groups and agents are performing based on open tickets.On Open tickets by agent group card, from Performers filter, select Bottom.
The chart displays the agent groups with the highest number of open tickets.On Open tickets by agent card, from Performers filter, select Top.
The chart displays the agents with the fewest open tickets, as a lower number of open tickets indicates better performance.
View top subcategories by Unresolved tickets on Analytics Reporting experience
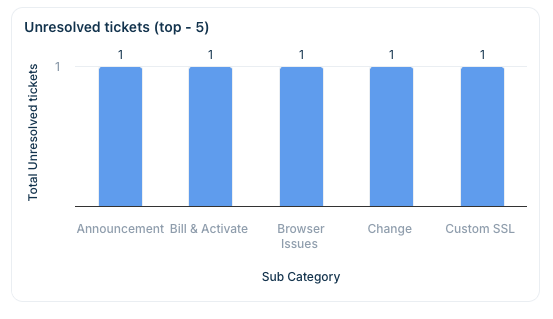
Unresolved tickets indicate the current workload. A lower number of unresolved tickets represents better performance. So when you select the Top ranking option, the categories with the fewest unresolved tickets are displayed. If you select the Bottom ranking option, categories with the highest number of unresolved tickets are displayed. Follow these steps to view the top subcategories by unresolved tickets.
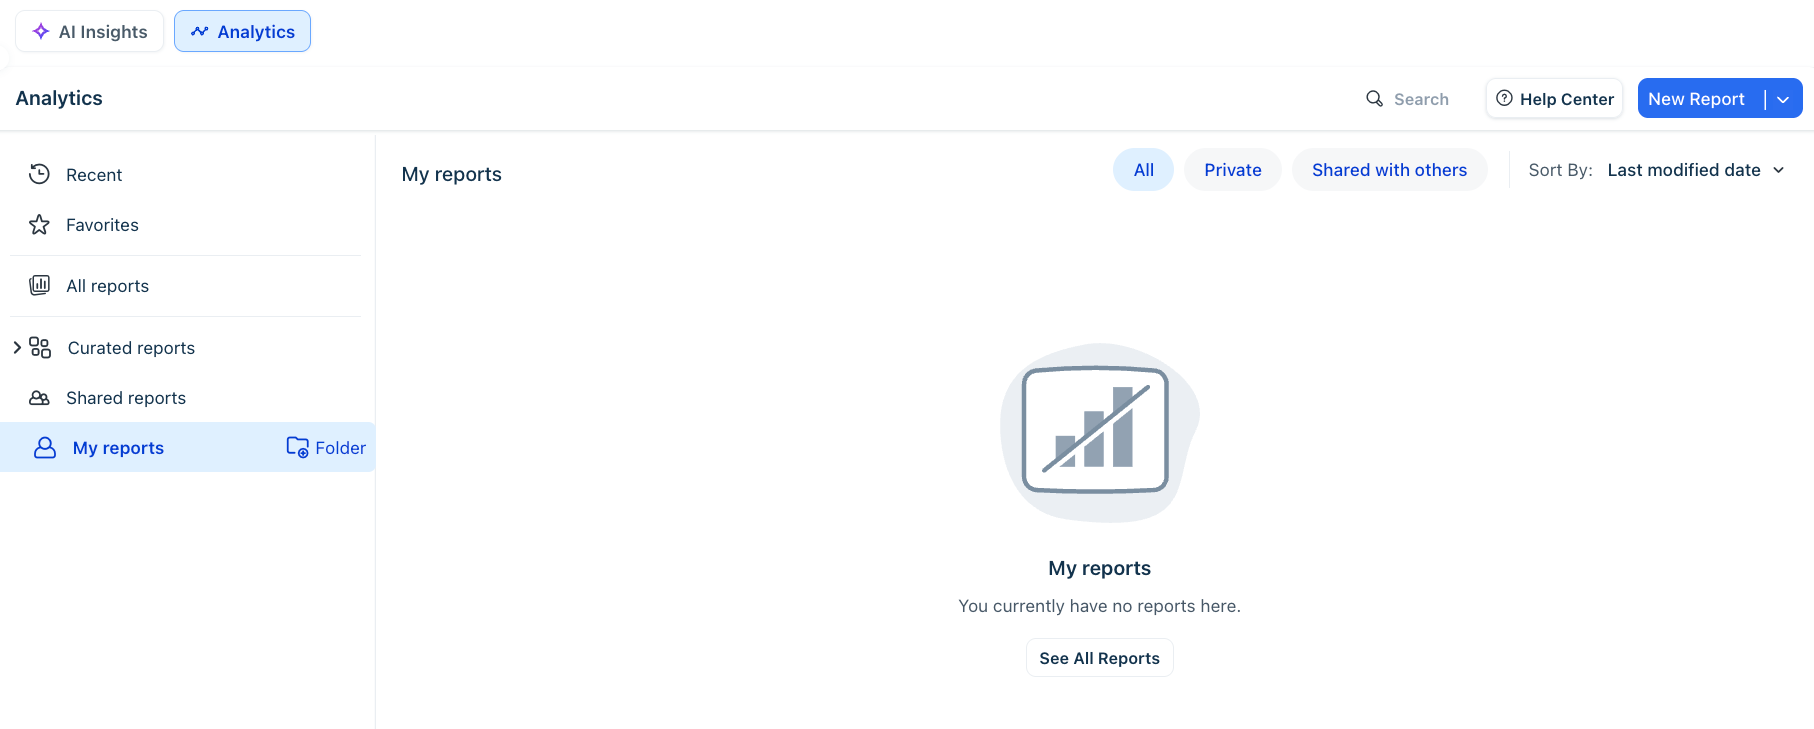
Go to Analytics and create a new report or edit an existing report. For details, see Building a new report.
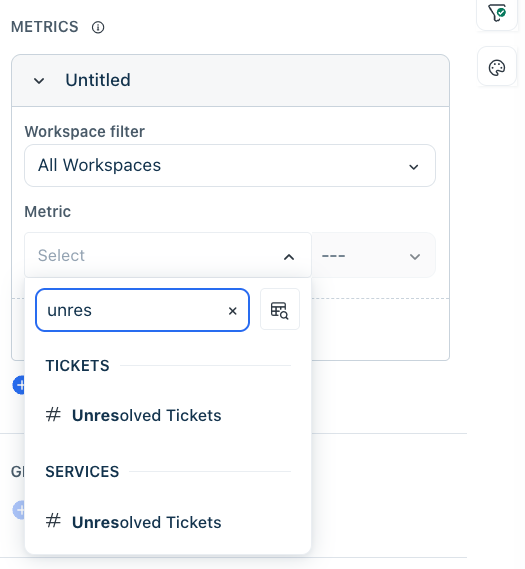
Under METRICS, select Unresolved Tickets.
Under GROUP BY, select Sub-category.
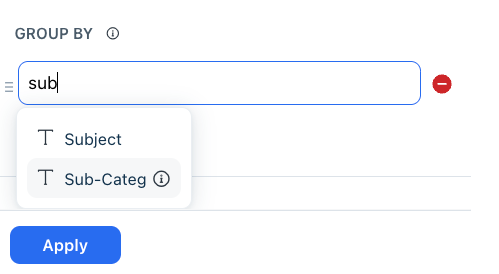
Click Apply.
Go to Filter > Rank Order.
Select Top and a required number from the drop down list.
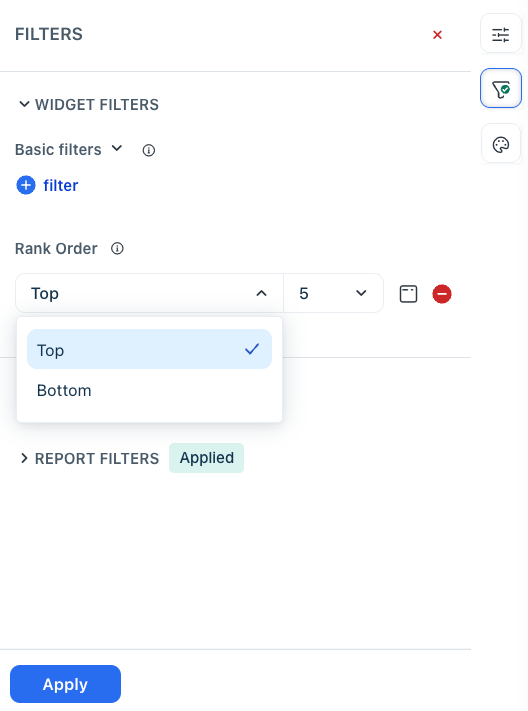
Click Apply.
The chart displays the subcategories with the lowest number of unresolved tickets. A lower number of unresolved tickets indicates better performance, so these subcategories are classified as the top-performing categories.