TABLE OF CONTENTS
Note: This functionality is currently available for selected customers only.
Monitor platform infrastructure usage using the Data Usage Analytics dashboard to view data storage, API consumption, and MCP activity. Gain visibility into usage trends, identify cost drivers, prevent overages, and make informed decisions to optimize performance and spending.
Access and manage your saved, shared, and curated reports to organize frequently used reports, collaborate with other users, and quickly return to relevant insights for ongoing monitoring and decision-making.
View data usage reports
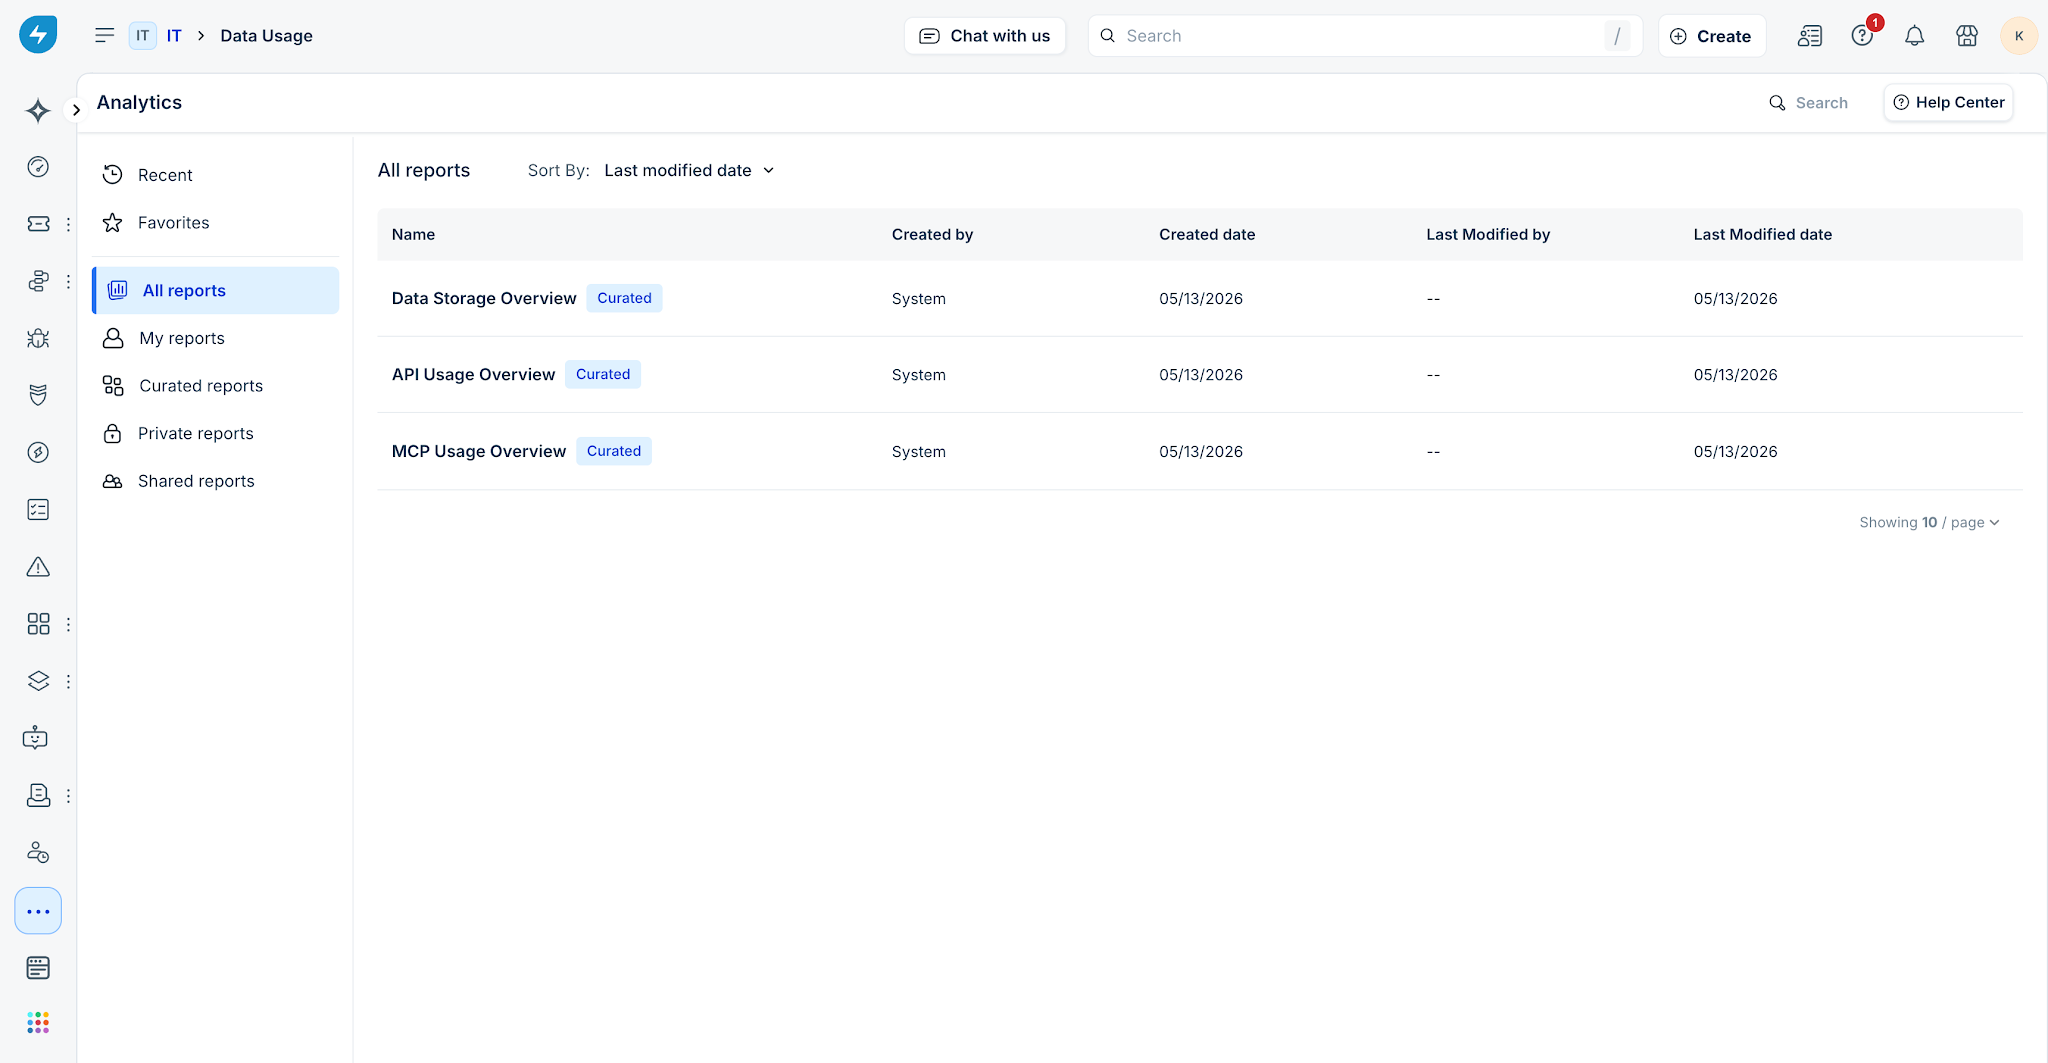
Access comprehensive reports to monitor key usage metrics across Freshservice, including storage, API activity, and MCP usage. There are three reports: Data Storage Overview, API Usage Overview, and MCP Usage Overview.
View Data Storage Overview
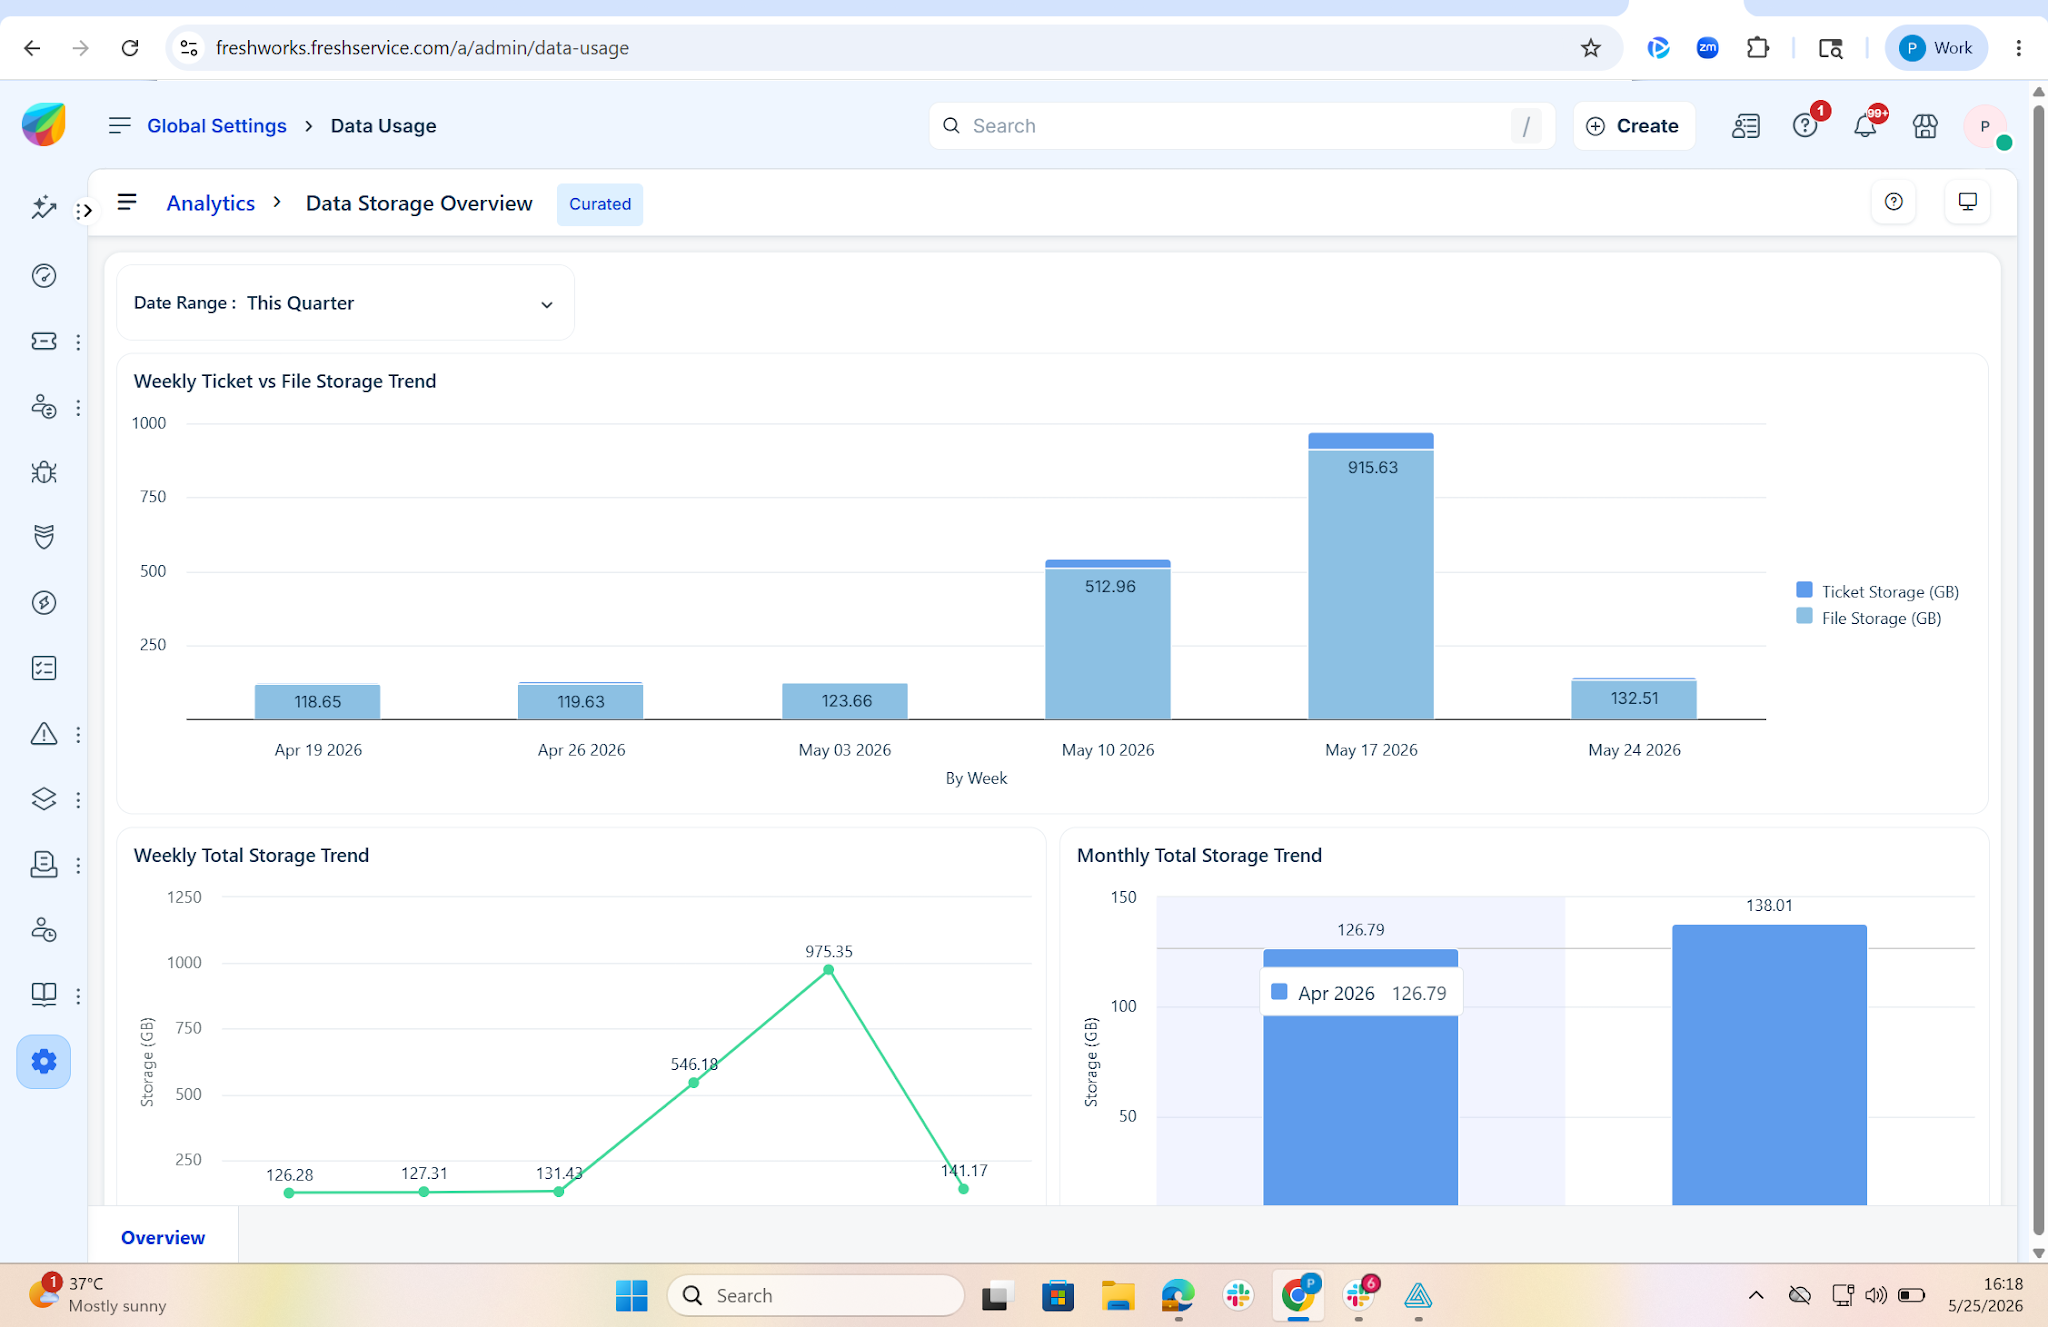
Monitor how data is stored and growing across your account. Track ticket and file storage usage, and identify trends to manage storage limits effectively.
Prerequisites: Ensure that you have administrator access to Freshservice.
Follow these steps to view data storage reports in Freshservice:
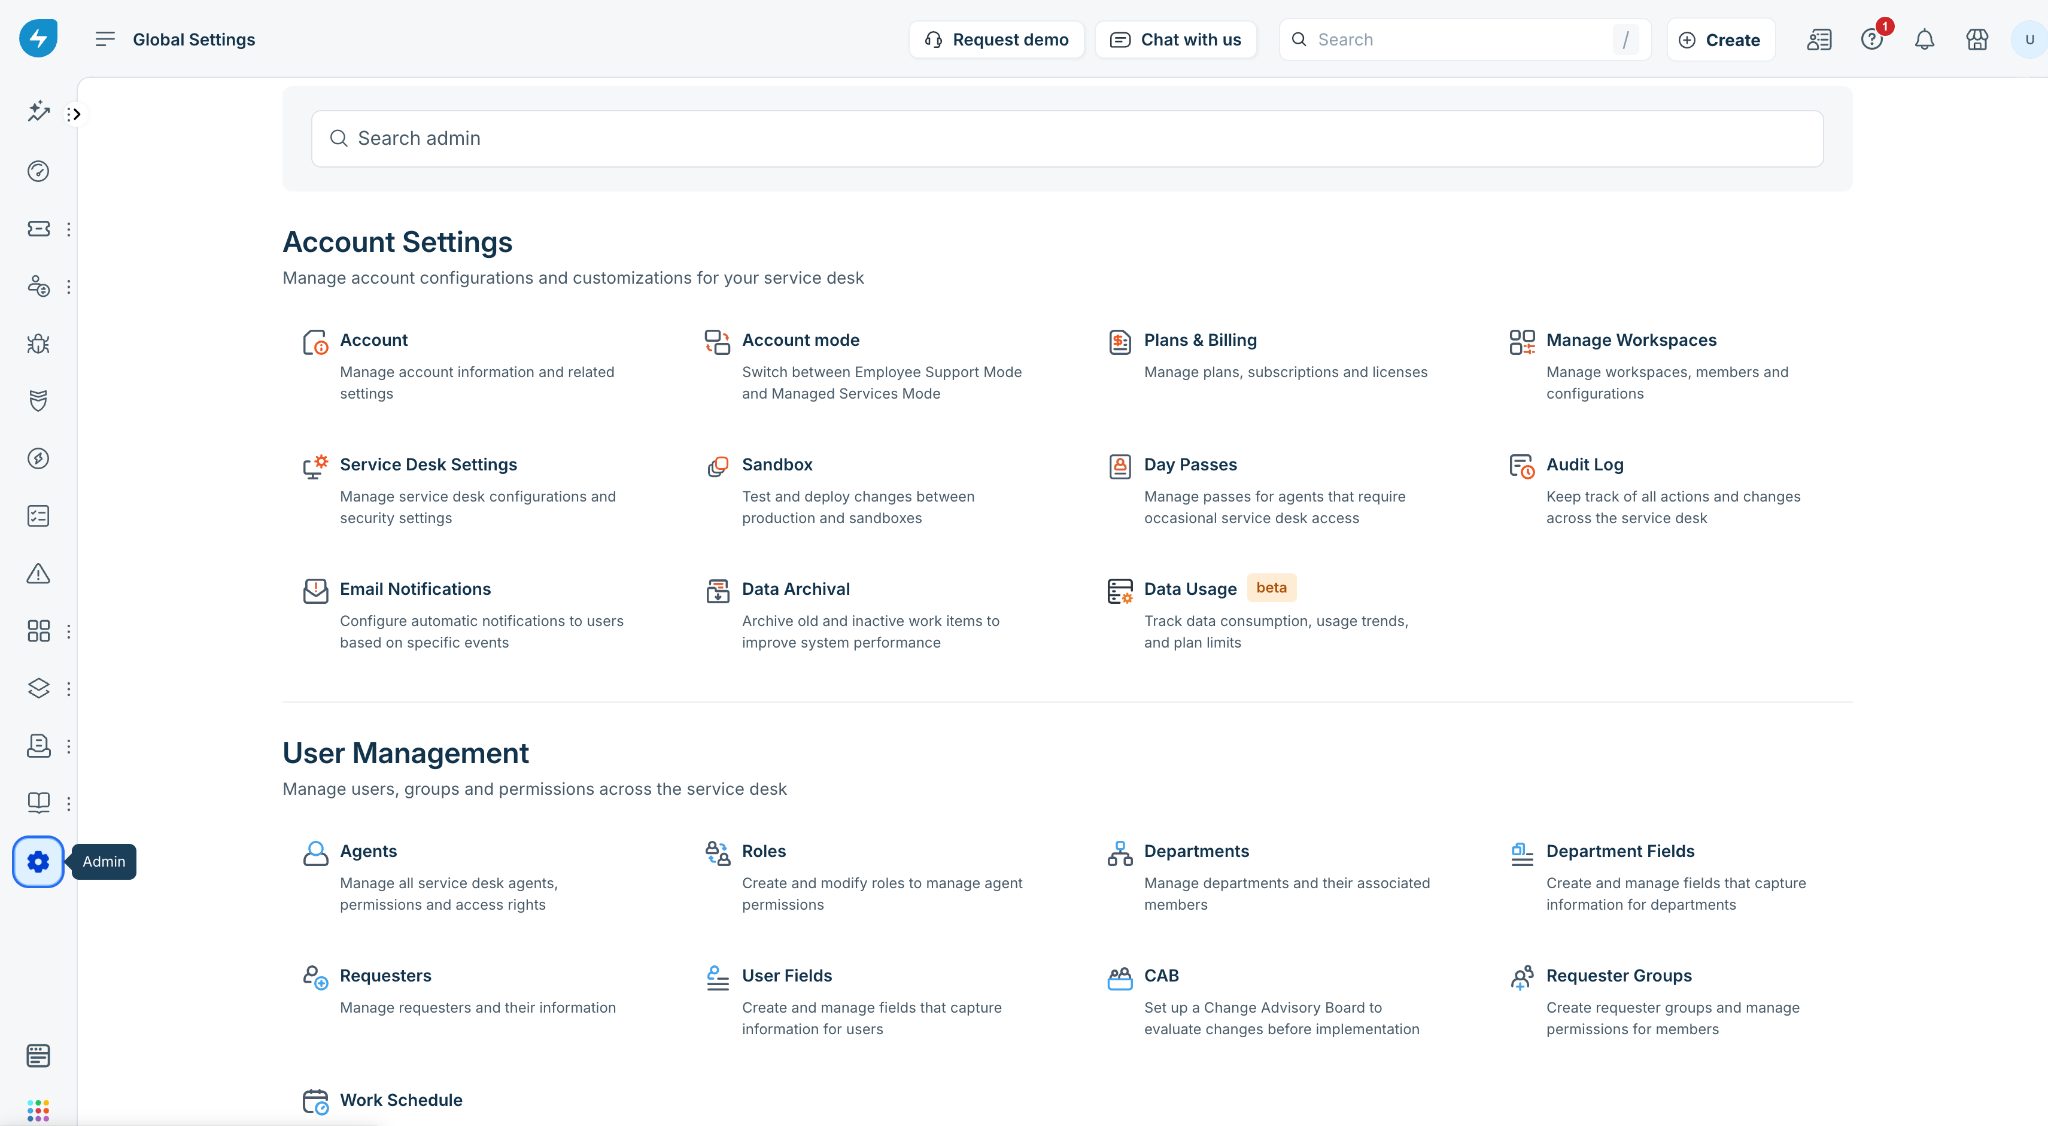
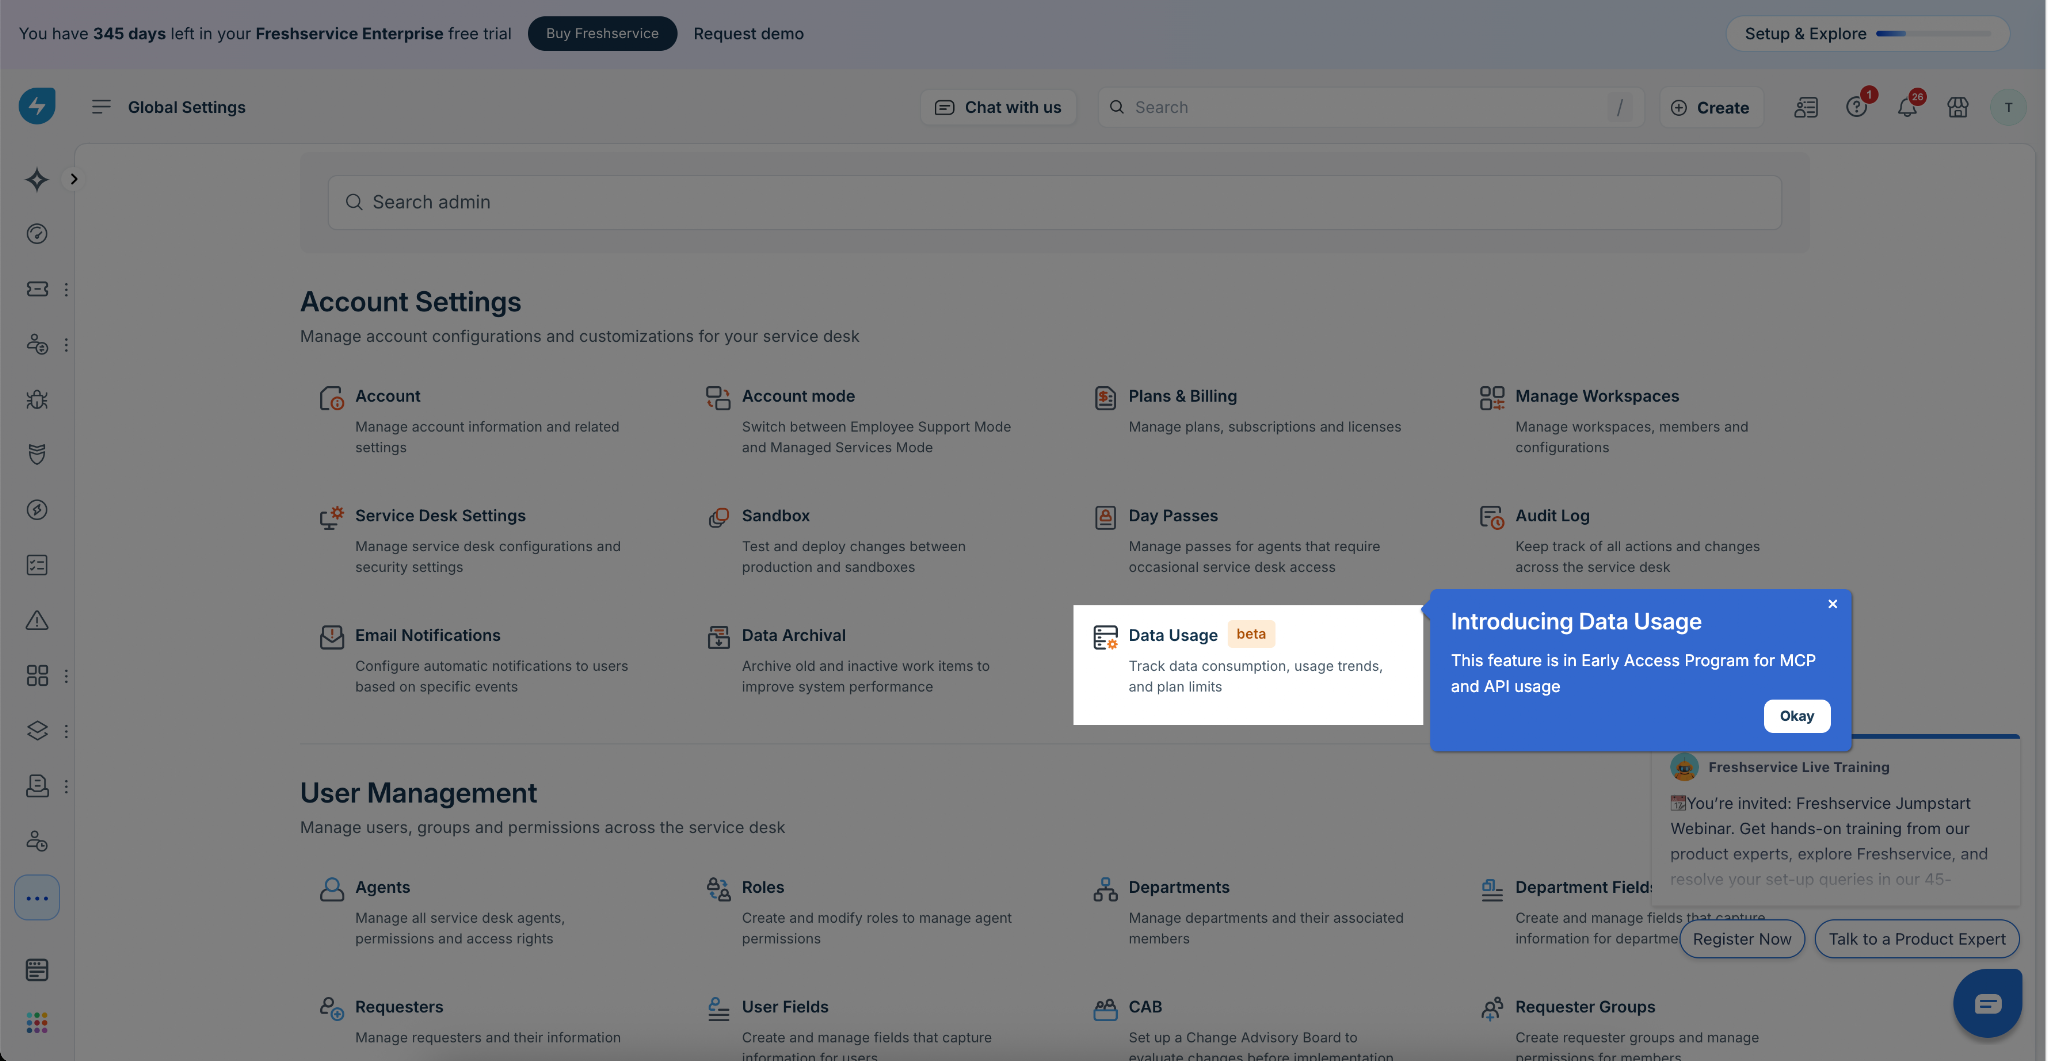
- Log in to Freshservice and go to Admin.
- Under Account Settings, select Data Usage.


You are redirected to the Analytics page.

- Click Data Storage Overview to open the data storage report.
The following data storage report appears and gives you insights into ticket and file storage usage.
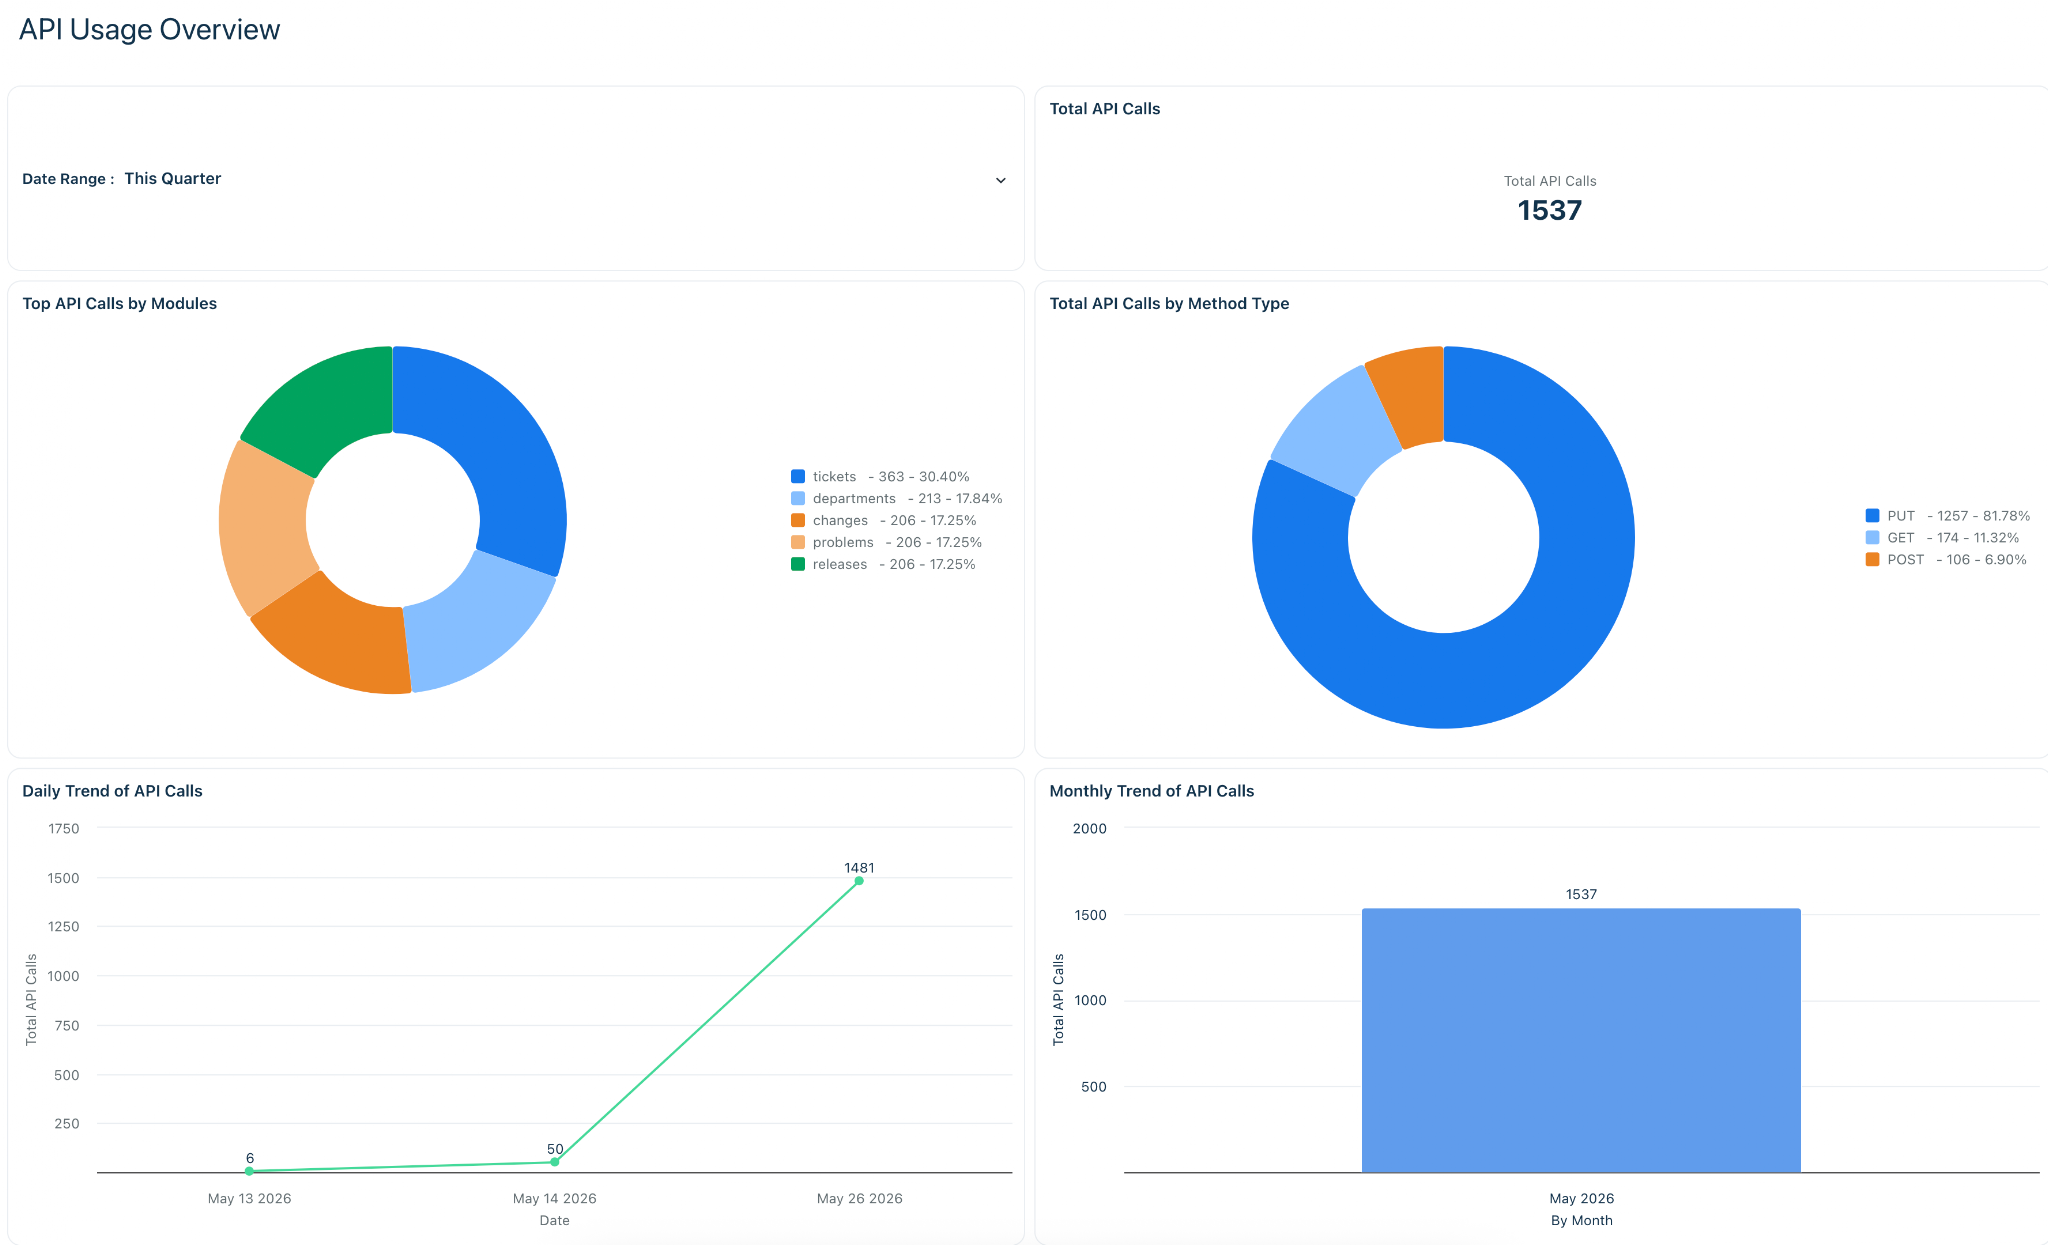
View API Usage Overview
Track API consumption across modules and methods. Use this report to monitor usage patterns, detect spikes, and manage API limits.
Prerequisites: Ensure that you have administrator access to Freshservice.
Follow these steps to view API usage reports in Freshservice:
Log in to Freshservice and go to Admin.
Under Account Settings, select Data Usage.

You are redirected to the Analytics page.

Click API Usage Overview to open the API usage report.
The following API usage report appears and gives insights into API consumption across modules and methods in your Freshservice account.
View MCP Usage Overview
Monitor Model Context Protocol (MCP) activity across your platform. Track inbound and outbound tool calls, execution status, and usage trends.
Prerequisites: Ensure that you have administrator access to Freshservice.
Follow these steps to view MCP usage reports in Freshservice:
Log in to Freshservice and go to Admin.
Under Account Settings, select Data Usage.

You are redirected to the Analytics page.
Click API Usage Overview to open the MCP usage report.
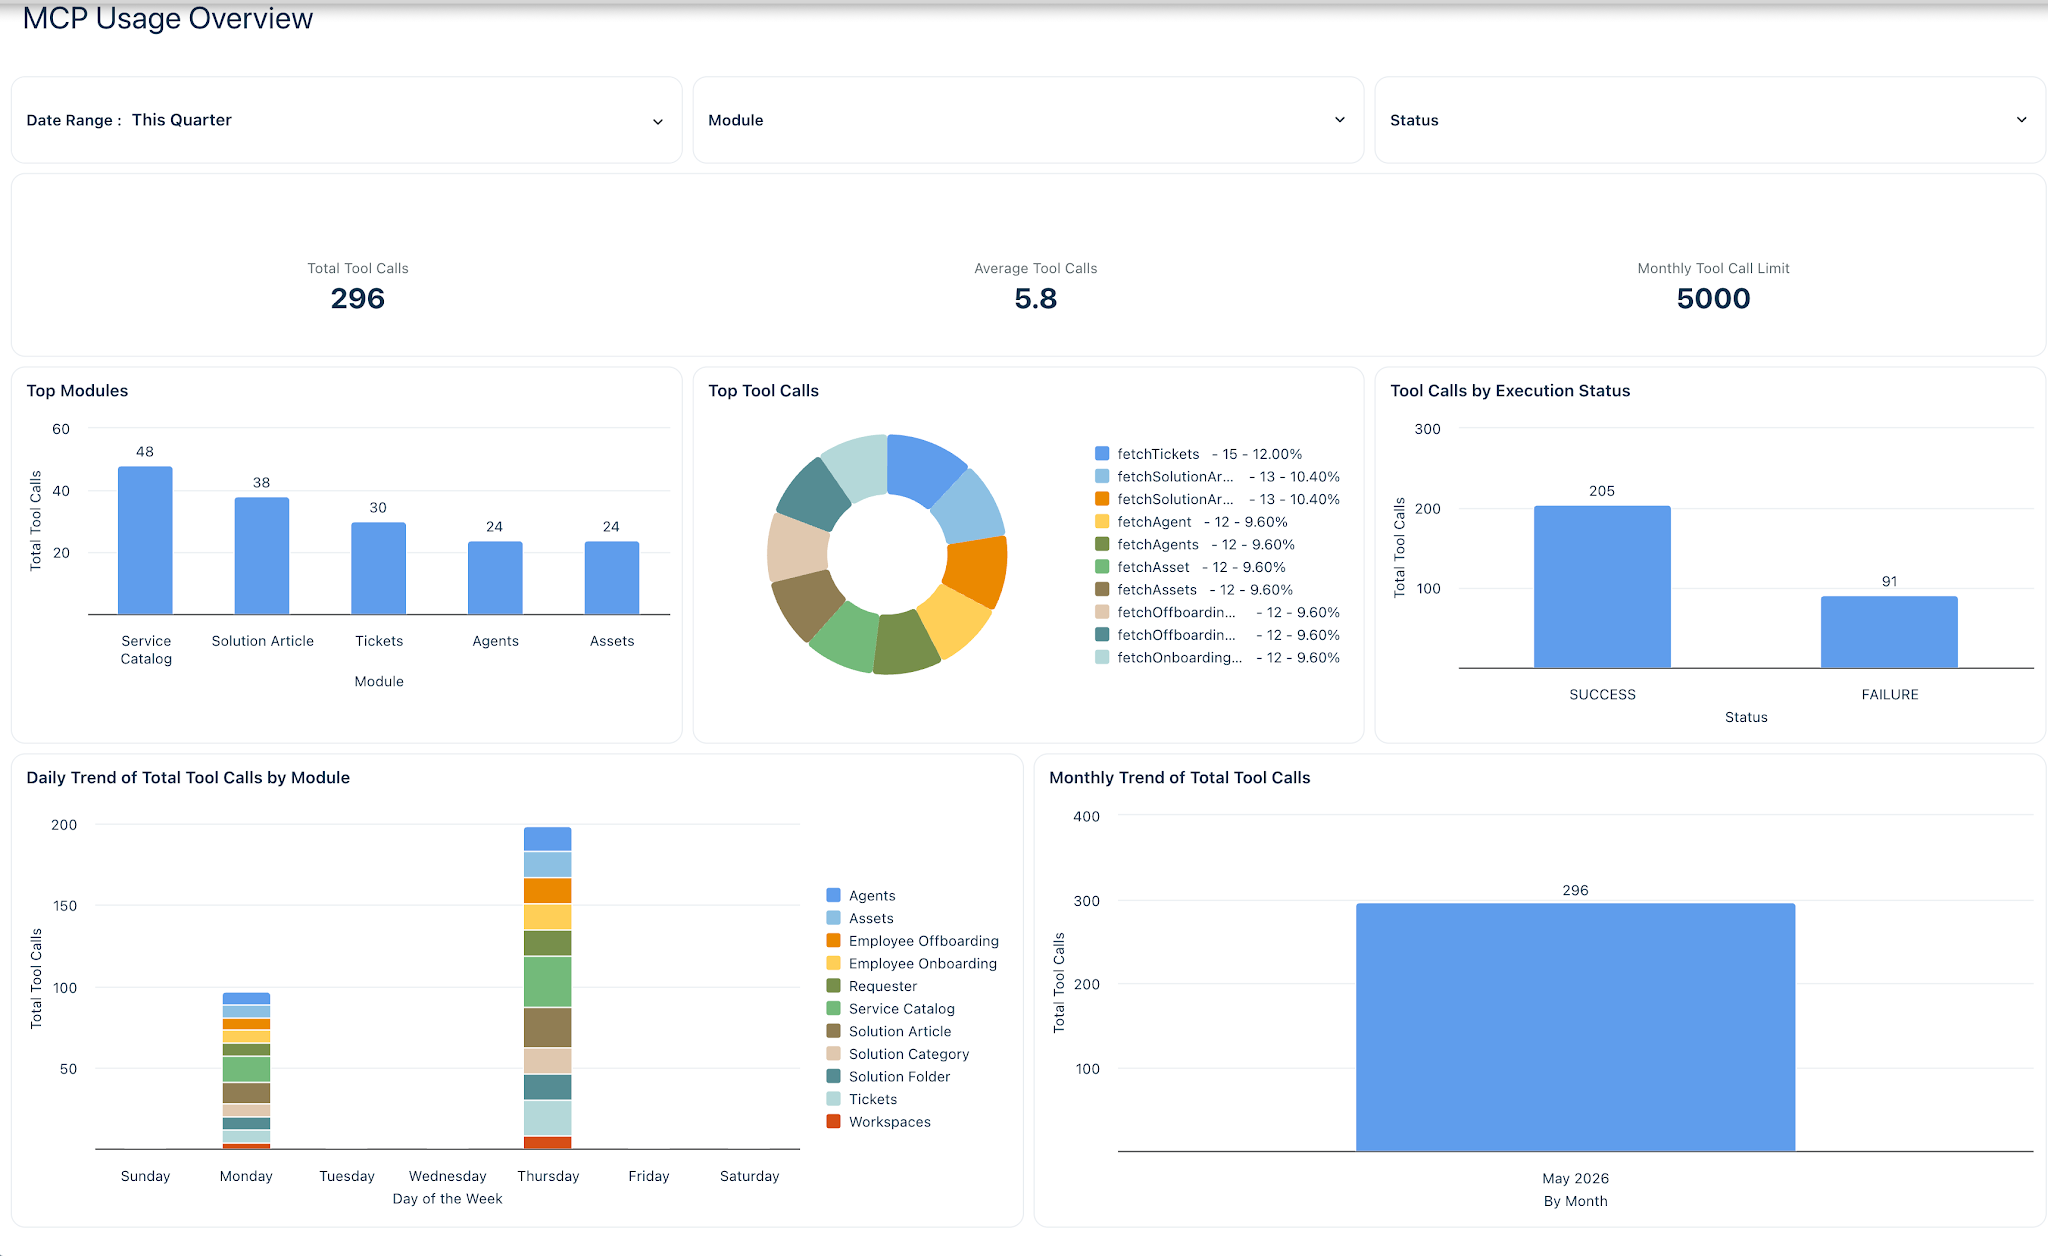
You can view the following Inbound and Outbound MCP usage reports:Use this Inbound MCP usage report to audit MCP tool call volumes, usage split across modules, across tool calls, execution status and daily and monthly trend.
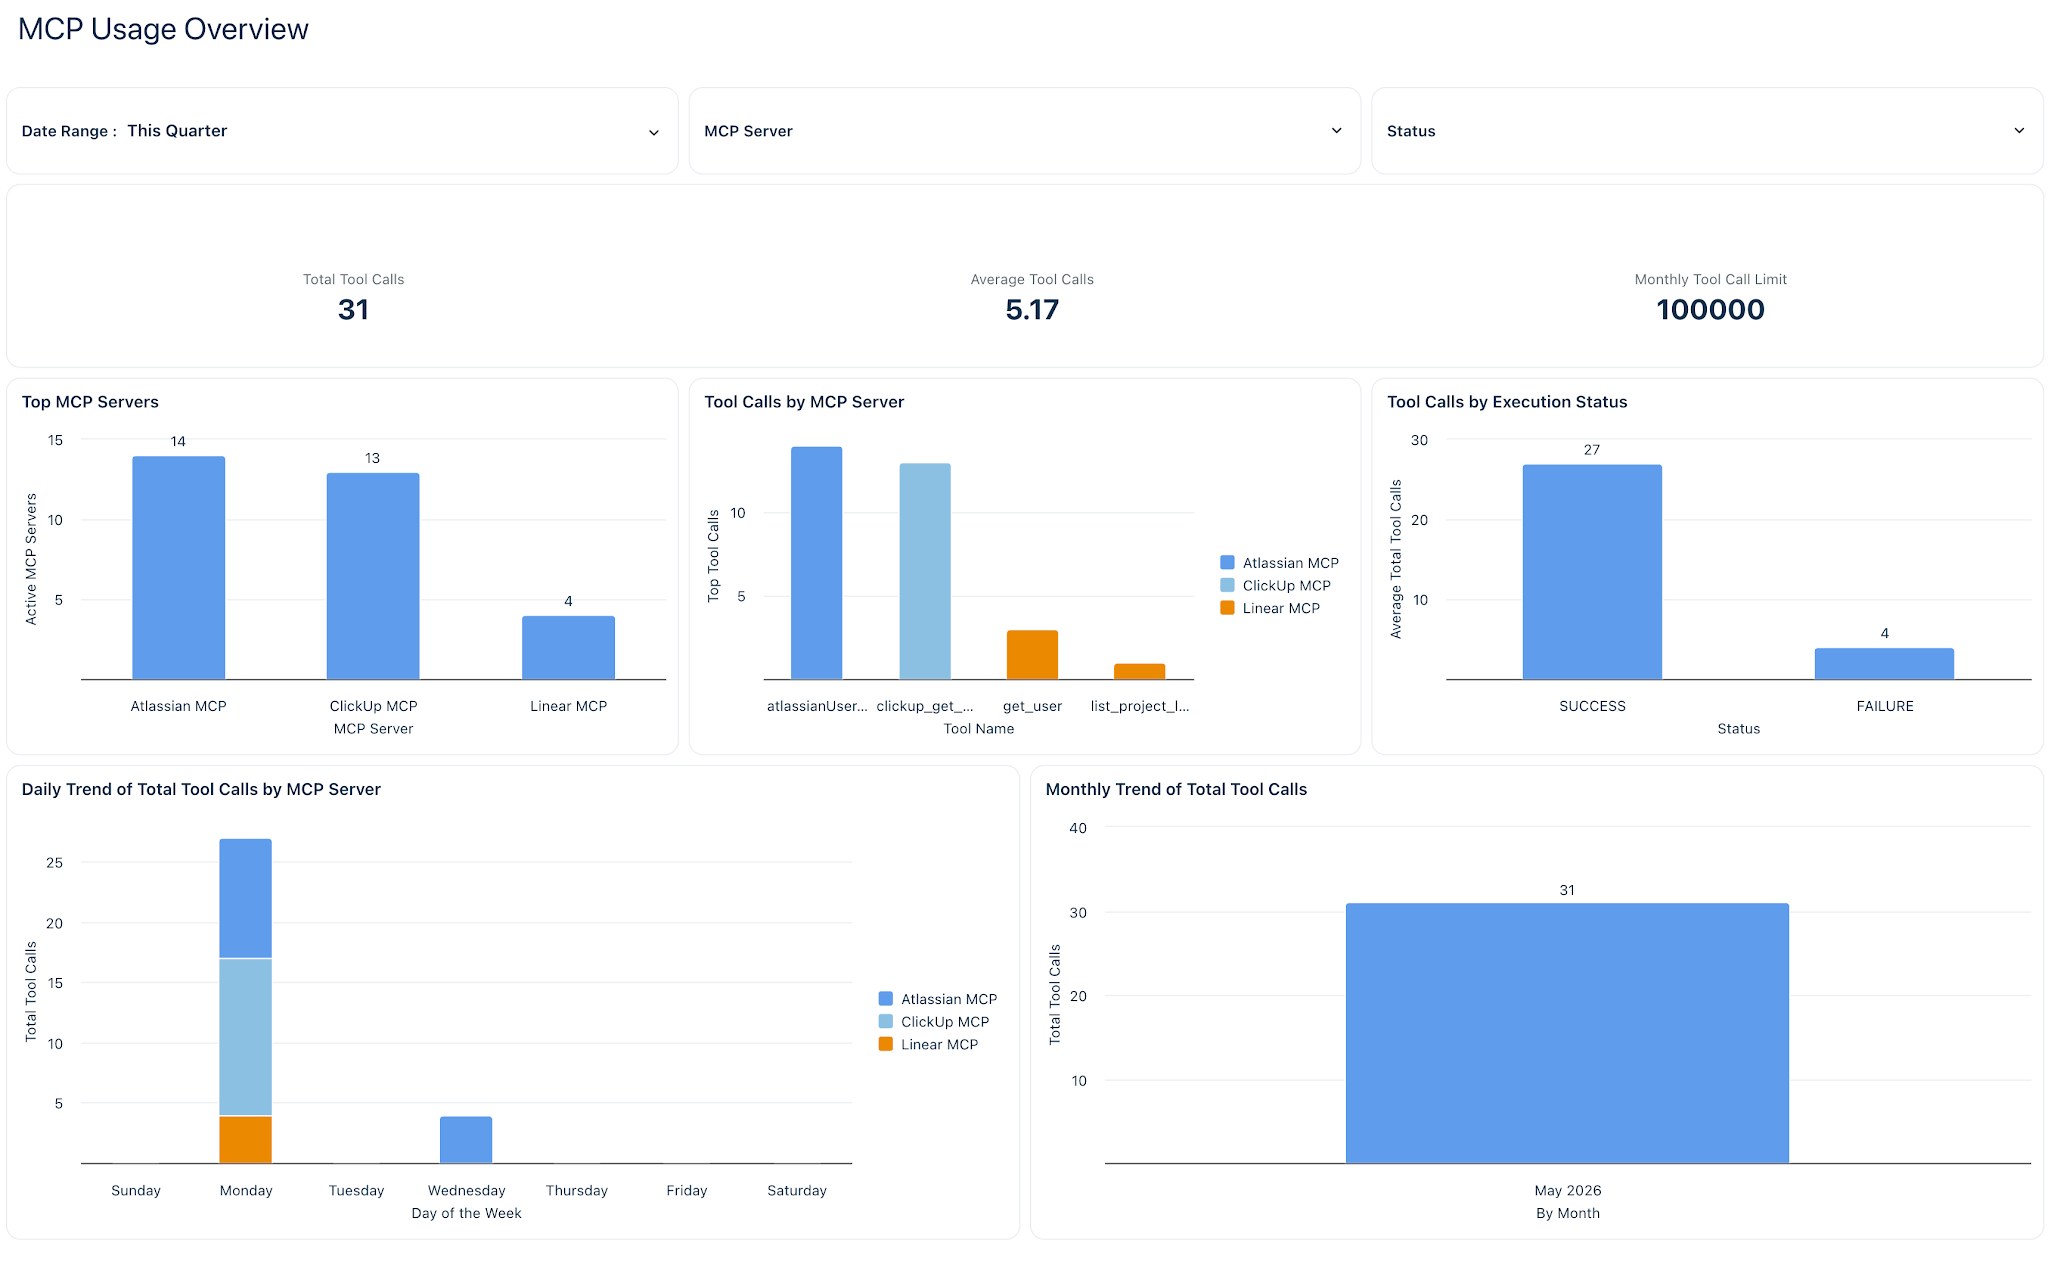
Use this Outbound MCP report to audit MCP tool call volumes, usage split across outbound MCP servers, across tool calls, execution status and daily and monthly trend.