TABLE OF CONTENTS
Set up alert management by integrating Freshservice with monitoring tools. Freshservice supports integration with several monitoring tools. Set up monitoring capabilities under Admin Settings > IT Operations Management > Monitoring tools.

Integrating monitoring tools
- On the Monitoring Tools page, click Add Monitoring Tool.

- Choose the monitoring tool to integrate with. If not listed, select Email to use email as a channel to ingest alerts into Freshservice. You may also use Webhooks or pre-built configurations to create a custom integration.
 For pre-built configurations, select the monitoring tool, copy the authorization details, and paste them into your monitoring tool to start receiving alerts in Freshservice.
For webhooks, name the integration, add a description, and copy the alert payload from the monitoring tool and paste it into the provided field. Map fields from the alert payload to the payload field in Freshservice. This exercise ensures that all alerts from multiple monitoring tools are consistently displayed. The JSON payloads received from webhooks are displayed in a column to help with debugging.
- Scroll down to map severity values used by your monitoring tool to those used in Freshservice.

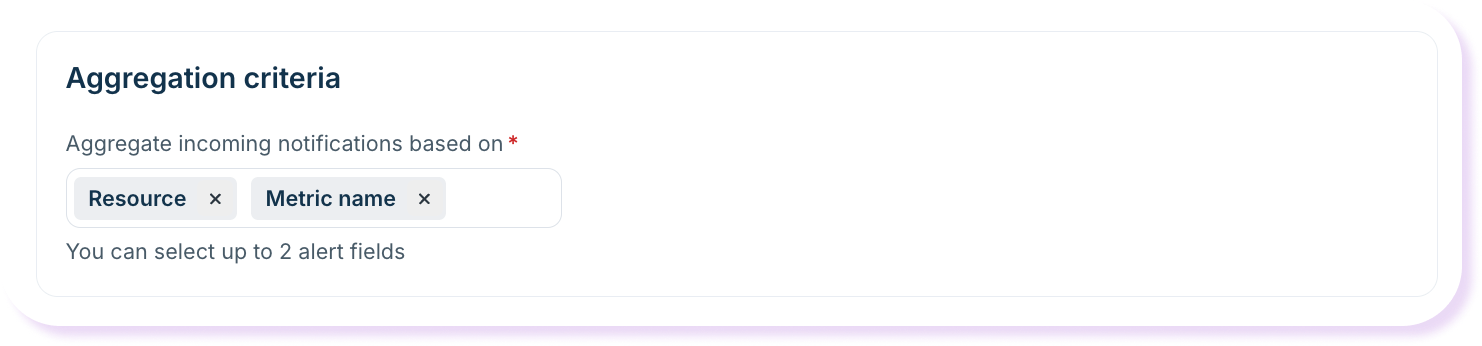
- Scroll down to choose the factors based on which incoming notification would be grouped to reduce alert noise. You can group notification based on Resource, Metric, Node, and Message values, by choosing a minimum of two values.
- Select Save when done.
Note: Freshservice automatically resolves alerts when the severity value turns ok. But if another related notification is received within 30 minutes, the alert is reopened. You can change this time interval by selecting advanced settings. You can also choose to undo automatic alert acknowledgement when an alert reopens.

For integration using email
Users can also ingest alerts into Freshservice using email as a channel. This option can be useful when your monitoring tool doesn't support integrating with Freshservice via webhooks. The incoming notifications from monitoring tools can be tracked as alerts and they can be turned into incidents via alert workflows only when they are required to be actioned upon. This way, you can filter the signal from the noise.
Learn how to use email as a channel for alerts in Freshservice.
Check integration status under the Activities tab
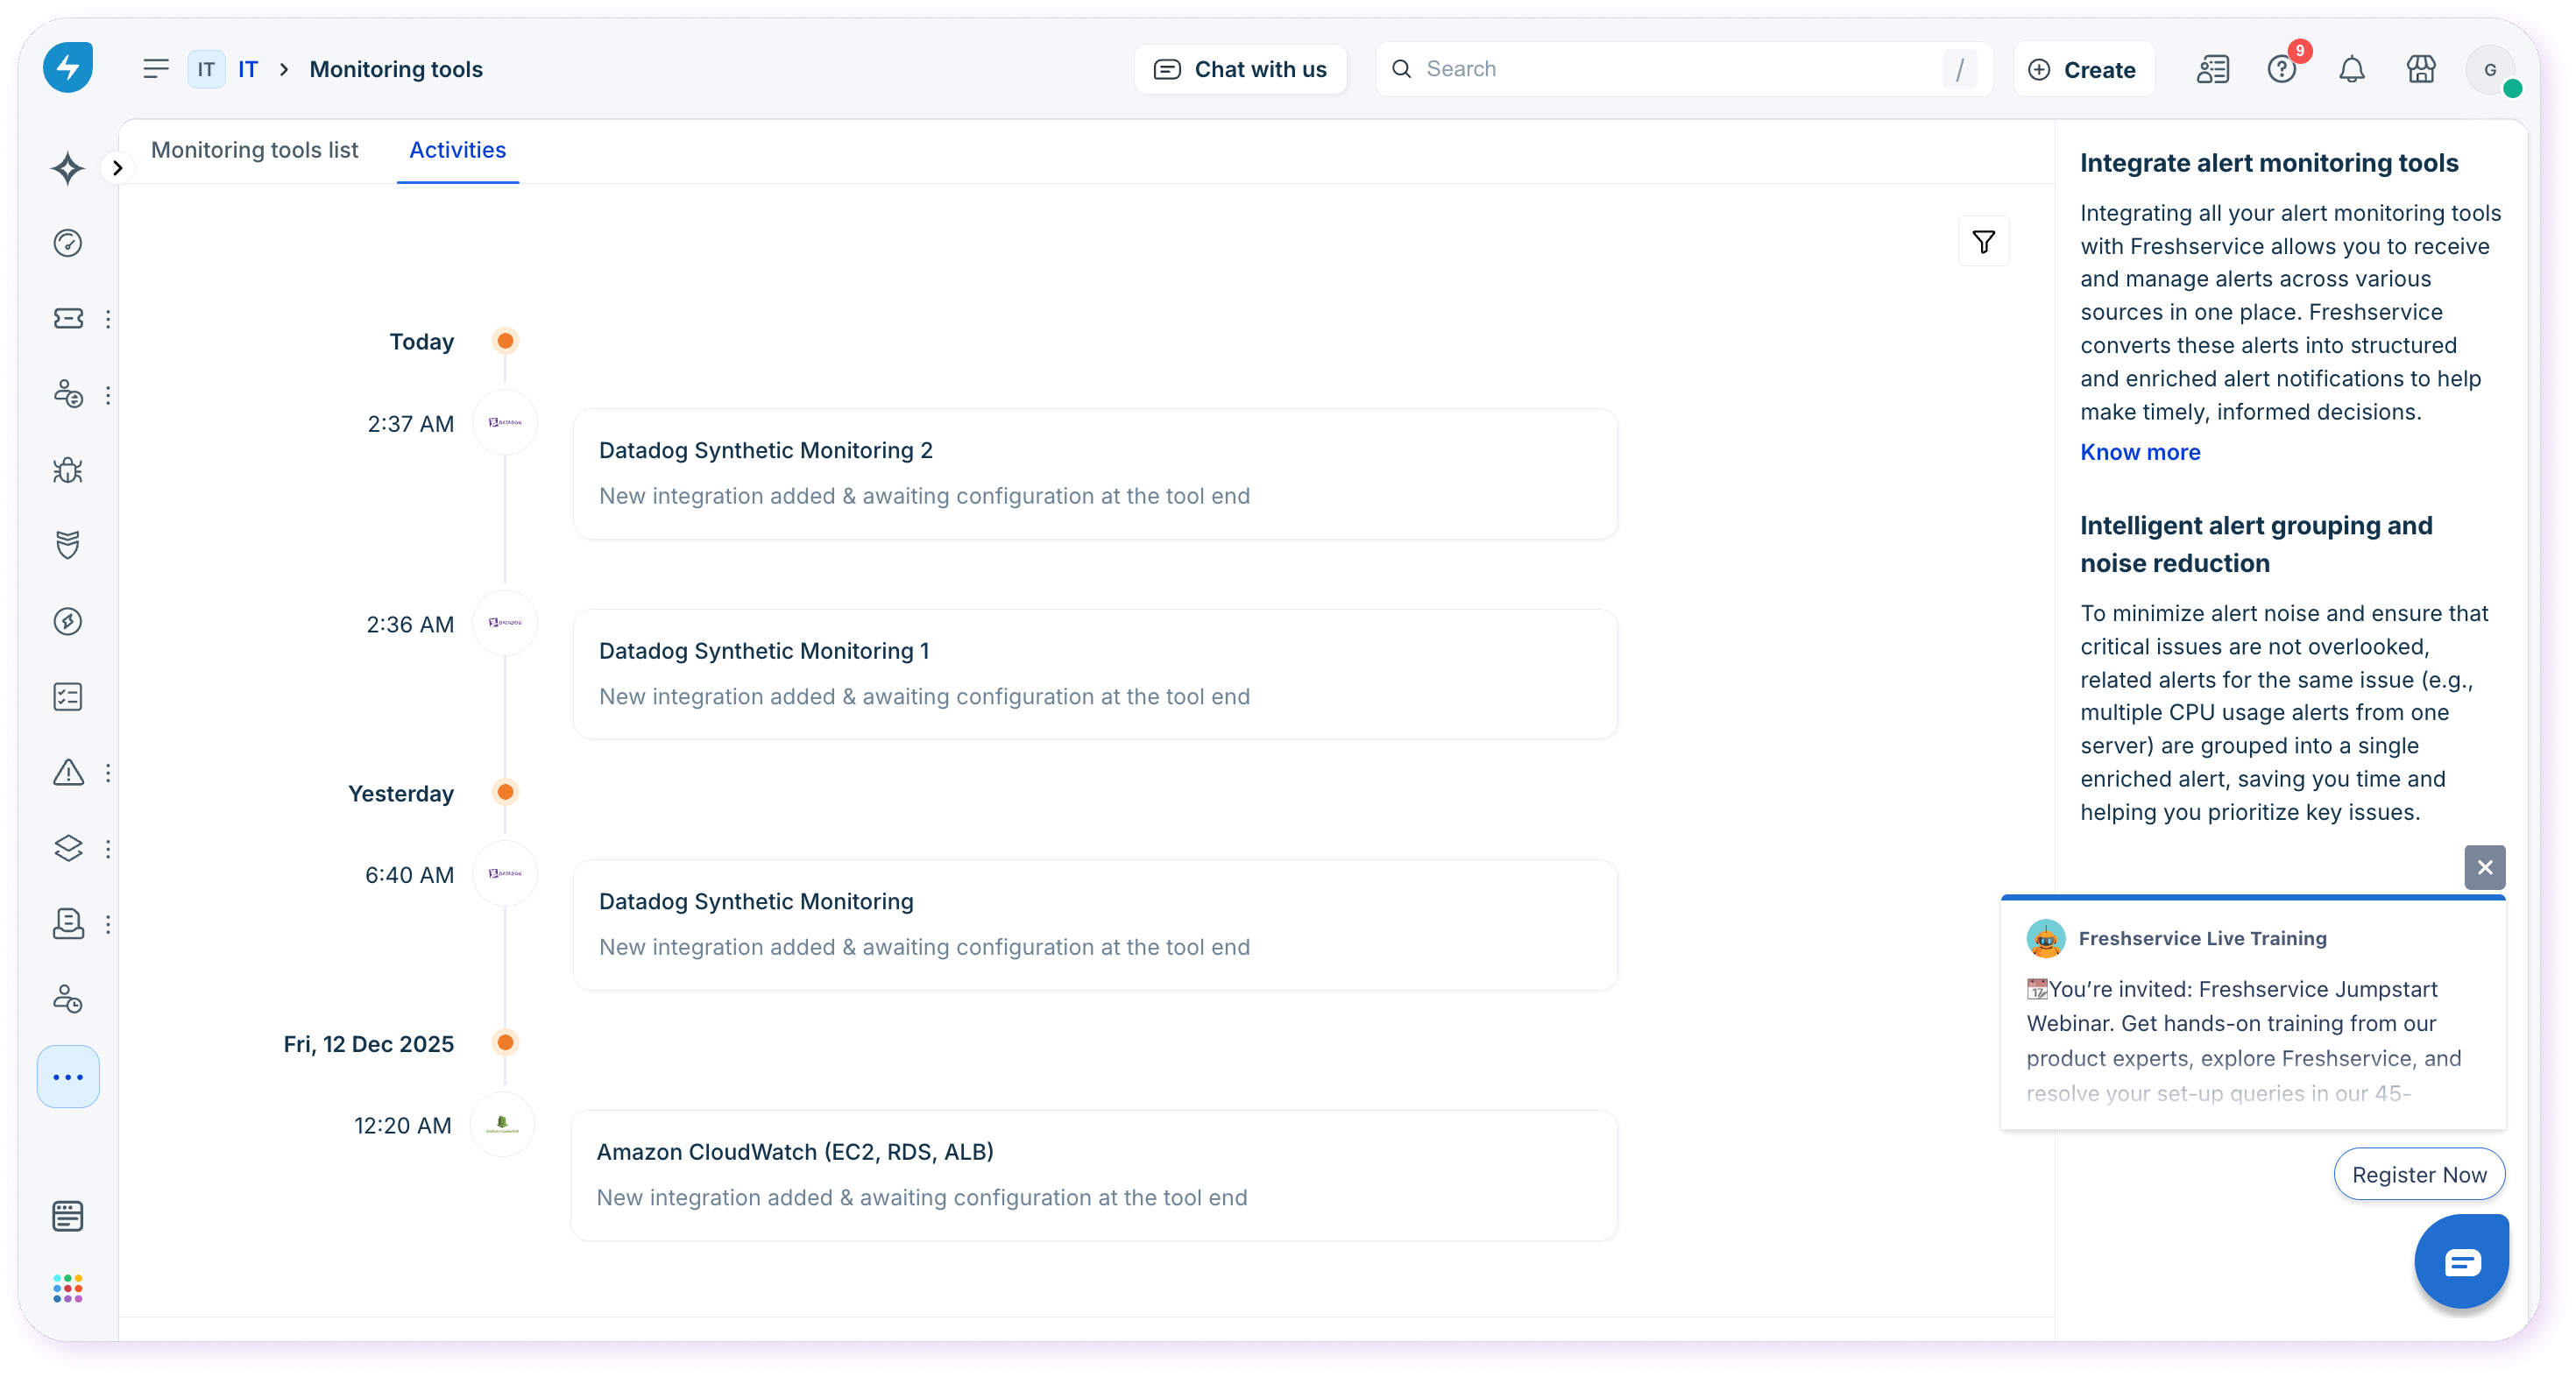
To refer to the status of the integration, head to the Activities tab in the Monitoring Tools list page. Here, you will see time stamped updates related to the activities related to your monitoring tools. This tab lists eight kinds of updates:
New integration added & awaiting configuration at the tool end
Integration has been enabled
Integration running successfully
Integration has been disabled
Integration has been deleted
Errors resolved: Integration running successfully
Authorization error: Ensure that the Freshservice header is included in the monitoring tool configuration and if the auth-key is correct
Error: Ensure that the payload from the monitoring tool is in JSON format and is correct
These updates will help you better understand the status of your monitoring tool integration and fix errors if needed.
View Alerts
Select the Alerts icon on the left nav to see the alerts list page. Here you will be able to view alerts from all your monitoring tools after noise reduction, in addition to associated incidents and major incidents, and even save custom views.
