TABLE OF CONTENTS
- Summary
- Option 1 – Create a service and map monitoring tools to it
- Option 2 – Associating a monitoring tool with one or more services
Summary
Service Health Monitoring can be set up in two ways:
- Option 1 – Manually create a service and map monitoring tools to it: Choose this option if you are going to integrate a new monitoring tool with Freshservice
- Option 2 – Associate a monitoring tool to one or more services: Choose this option if you have already integrated one or more monitoring tools with Freshservice
Note: To use Service Health Monitoring, it is essential to enable, set-up, and use the Freshservice Alert Management System.Option 1 – Create a service and map monitoring tools to it
Click on the Alert icon on the left nav to access Service Health monitoring.

You are now on the service list page that showcases sample data. Click on New Service.

Enter relevant information about the new service in the form that pops up from the right side of the screen.
Give the service a name such as Payments, Checkout, etc.
Provide a description if required
Specify the service type i.e. Business or Technical
Choose the impact of the service if it were to go down
Select the agent group to be notified whenever the service goes down
Select the individual point of contact for this service
Attach relevant files if needed

You are now on the service details page. On this page you will be able to view the information you entered about the service.

Plus, you will see the following functionalities:
Relationships: Use it to map all assets powering a service
Associations: Use it to check the top five alerts and incidents associated with the service. Click on View All to view all the associated alerts and incidents.
Alert configurations: Use it to access the monitoring tools generating the alerts that define the state of the service
Activities: Use it for a timeline view of the progression of events related to the service
On-call details: Use it to check the on-call agent group associated with the service
To start monitoring the state of a service, you need to associate it with the monitoring tools generating the alerts that convey the state of the assets related to that service. Until you map one or more monitoring tools to a service, the tool will prompt you to do so.

Once you associate the monitoring tools with the service, you’ll see the top 5 alerts and incidents on the service overview tab.
Note: If you are mapping the service to a new monitoring tool, follow the setup instructions in this article.
Option 2 – Associating a monitoring tool with one or more services
You can also create a service through the Alert Management module by associating a monitoring tool with a new or existing service.
In the Admin pane, scroll down to the IT Operations Management section and click on Monitoring Tools

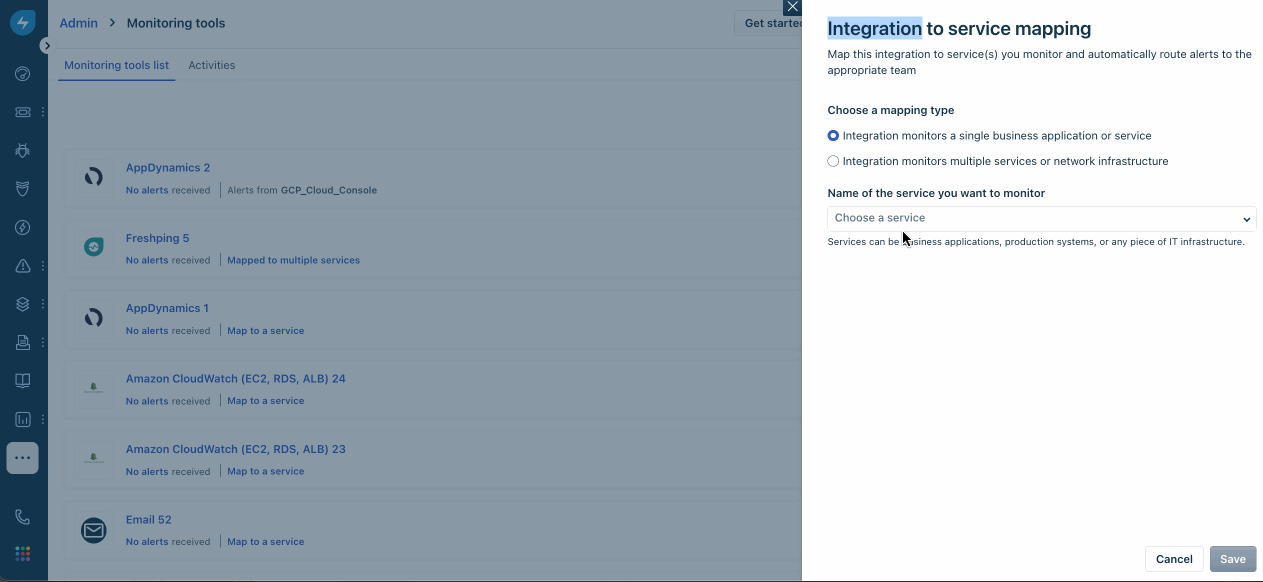
2. In the Monitoring Tools list page, choose the monitoring tool you want to associate with a service and click either on the Service icon or on Map to a service

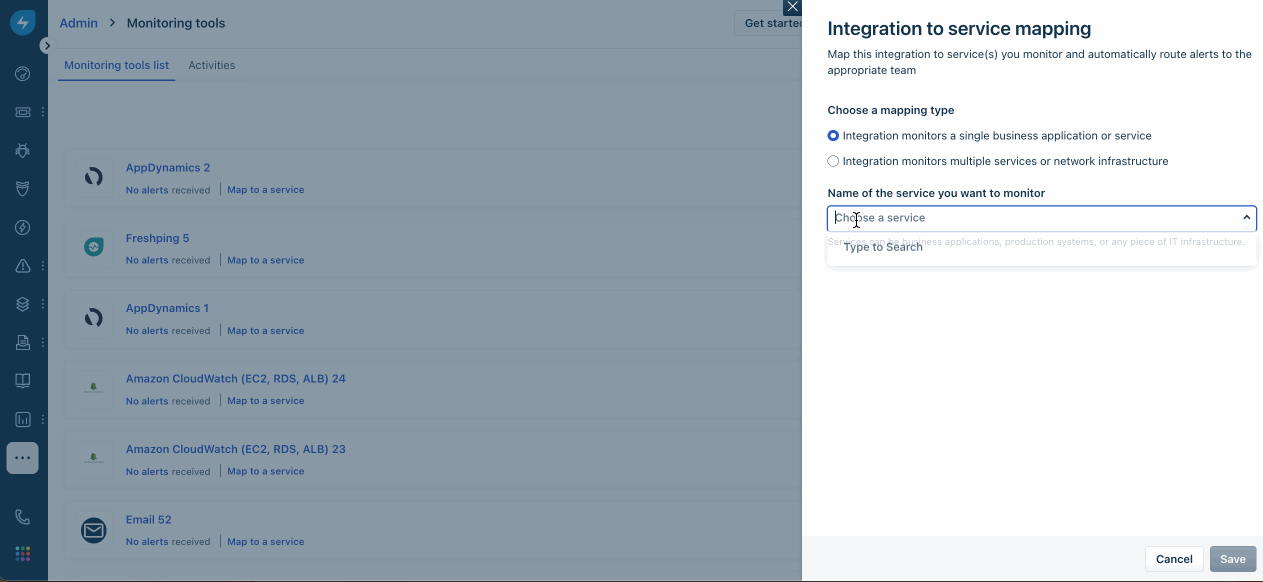
3. Next, choose whether you want to map the monitoring tool to a single service or multiple services
Mapping a monitoring tool to a single service
If you want to map the monitoring tool to a single pre-existing service:
Start typing out the name of the service in the text box
The tool will provide a dropdown listing services that match your search query
Choose the service you want to associate the monitoring tool with
The fields 'Managed by Group' and 'Managed By' will be self populated with details entered while creating that service
Click Save
If you want to map the monitoring tool to a new service:
Start typing out the name of the new service you want to create, in the text box
If it is unique string that doesn't match existing service names, the tool will offer a +create option in the dropdown
Select +create to create the new service
Click Save
Mapping a monitoring tool to multiple services
Select the second radio button i.e. 'Integration monitors multiple services or network infrastructure'
Choose a payload attribute that will help you identify the service. Use the + button to select the alert field to track
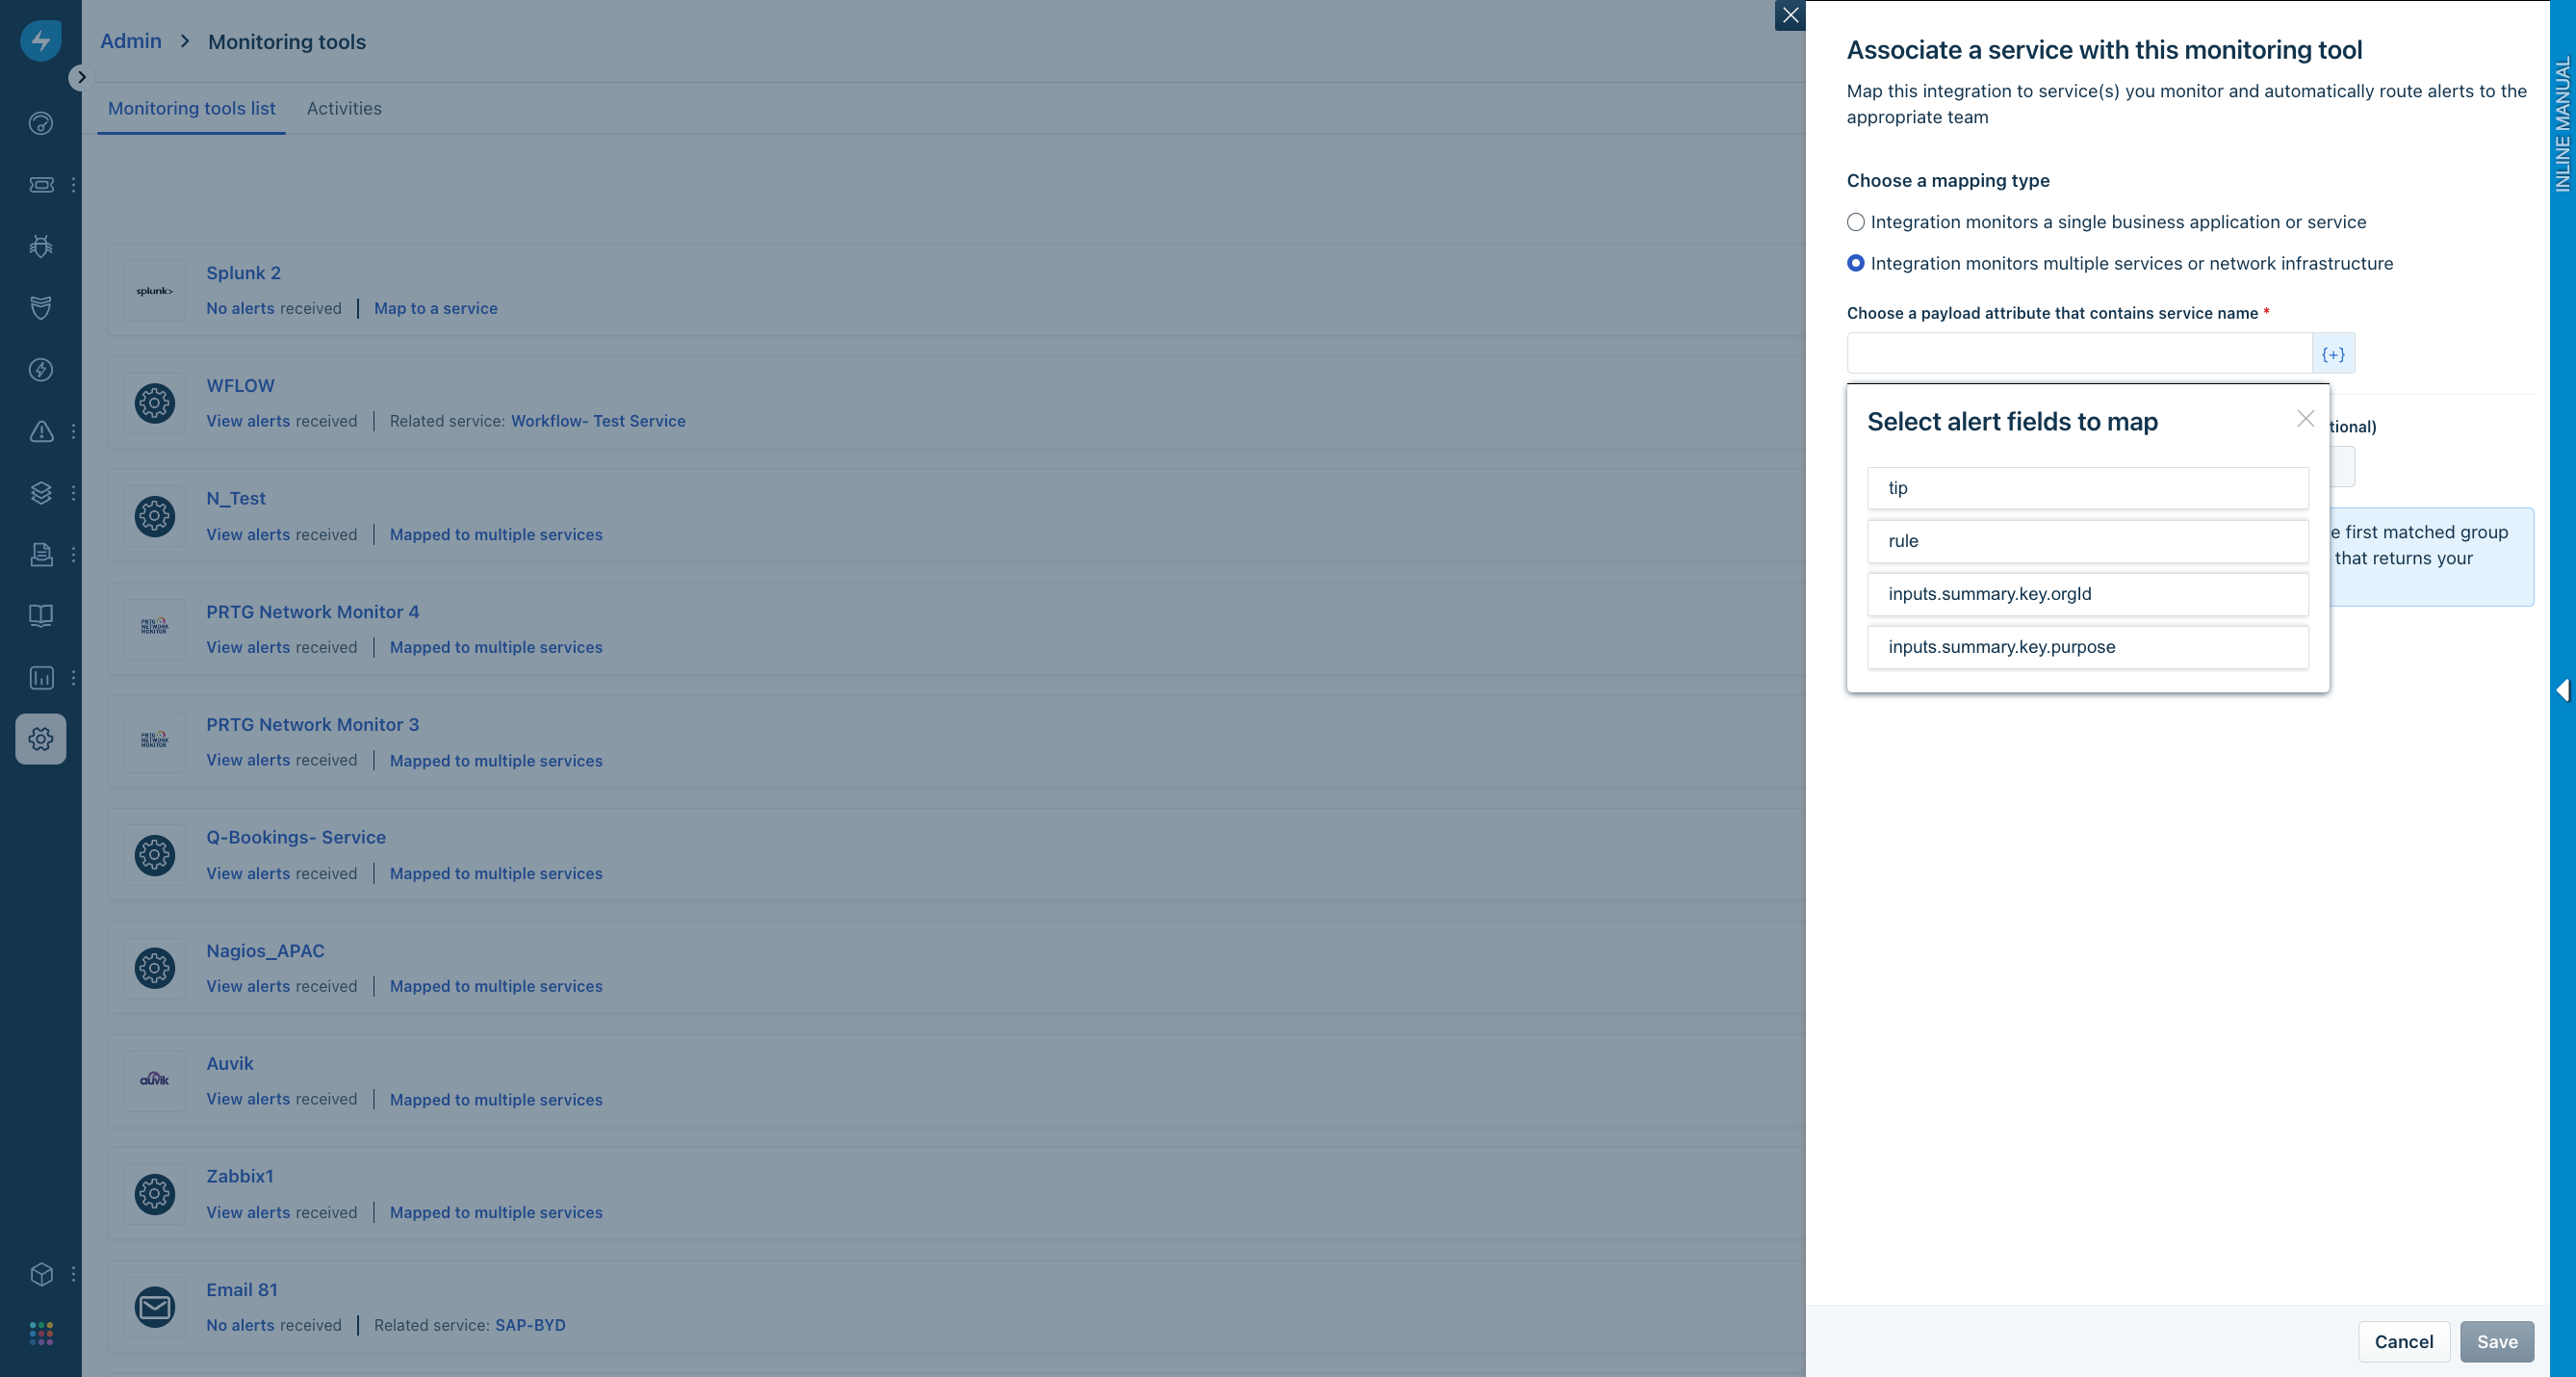
You can also specify the regex expression to extract the service name from the attribute. This step is optional. You can use any online tool available for free to validate your regular expressions and get more information about them. Some of them are listed below:
Save this configuration
When the tool starts identifying the specified regex in incoming alerts, it will surface them for consideration under Potential Services. For example, if you are looking for ^AWS-US-LOAD-BALANCER.* in the alert content, then the tool will surface all alerts with this string in them such as:
- AWS-US-LOAD-BALANCER- 1986
- AWS-US-LOAD- BALANCER- 2013
- AWS-US-LOAD- BALANCER- 2255

You will then need to approve the exact alert you want to create a service or associate with an existing service via Potential Services.
Previous <<< Define & monitor services using Service Health Monitoring
Next >>> Exploring Potential Services
Start typing out the name of the service in the text box
The tool will provide a dropdown listing services that match your search query
Choose the service you want to associate the monitoring tool with
The fields 'Managed by Group' and 'Managed By' will be self populated with details entered while creating that service
Click Save
Start typing out the name of the new service you want to create, in the text box
If it is unique string that doesn't match existing service names, the tool will offer a +create option in the dropdown
Select +create to create the new service
Click Save
Select the second radio button i.e. 'Integration monitors multiple services or network infrastructure'
Choose a payload attribute that will help you identify the service. Use the + button to select the alert field to track
You can also specify the regex expression to extract the service name from the attribute. This step is optional. You can use any online tool available for free to validate your regular expressions and get more information about them. Some of them are listed below:
Save this configuration
When the tool starts identifying the specified regex in incoming alerts, it will surface them for consideration under Potential Services. For example, if you are looking for ^AWS-US-LOAD-BALANCER.* in the alert content, then the tool will surface all alerts with this string in them such as: