TABLE OF CONTENTS
- Summary
- Why Service Health Monitoring?
- How to set up Service Health Monitoring?
- Mapping a monitoring tool to a single service
- Mapping a monitoring tool to multiple services
- Deleting a service
- Functionalities that you can make use of
Summary
Transcend to Service Oriented Operations (SOO) with Freshservice Service Health Monitoring. Meet and exceed service level agreements by discovering assets, mapping interdependencies, and monitoring business and technical services. Discover the ‘what’ of a service to decode ‘how’ to fix it best, to provide high quality services to your end users.
Why Service Health Monitoring?
To keep your business up and running and customers happy, your Service Desk and ITOps Teams manage tickets, requests, and alerts. Each of these provides a teaser of sorts into underlying issues. But connecting all this data with end-user experience is complicated and time-consuming. However, there is a better way to get the complete story. And it resides with your end users in the form of services they consume.
Imagine looking through the same lens as your end user. Once you manually map the assets powering a service, you would be viewing the state of the service – the value delivered to your end user – rather than the status of individual alerts or tickets. With this view, you’ll be able to identify all the tickets affecting a service, prioritize those with the maximum impact, and reestablish normalcy for your end-users sooner rather than later.
Freshservice Service Health Monitoring is a window that provides this user-centric perspective into the state of your business.
How to set up Service Health Monitoring?
Service Health Monitoring can be set up in two ways:
- Manually create a service and map monitoring tools to it
- Associate a monitoring tool to one or more services
Manual set up
Click on the Alert icon on the left nav to access Service Health monitoring.
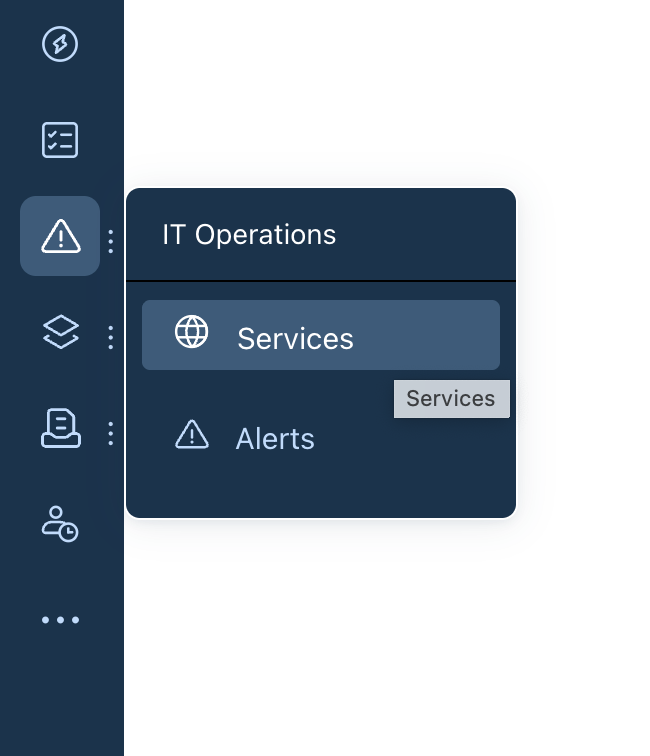
You are now on the service list page that showcases sample data. Click on New Service.
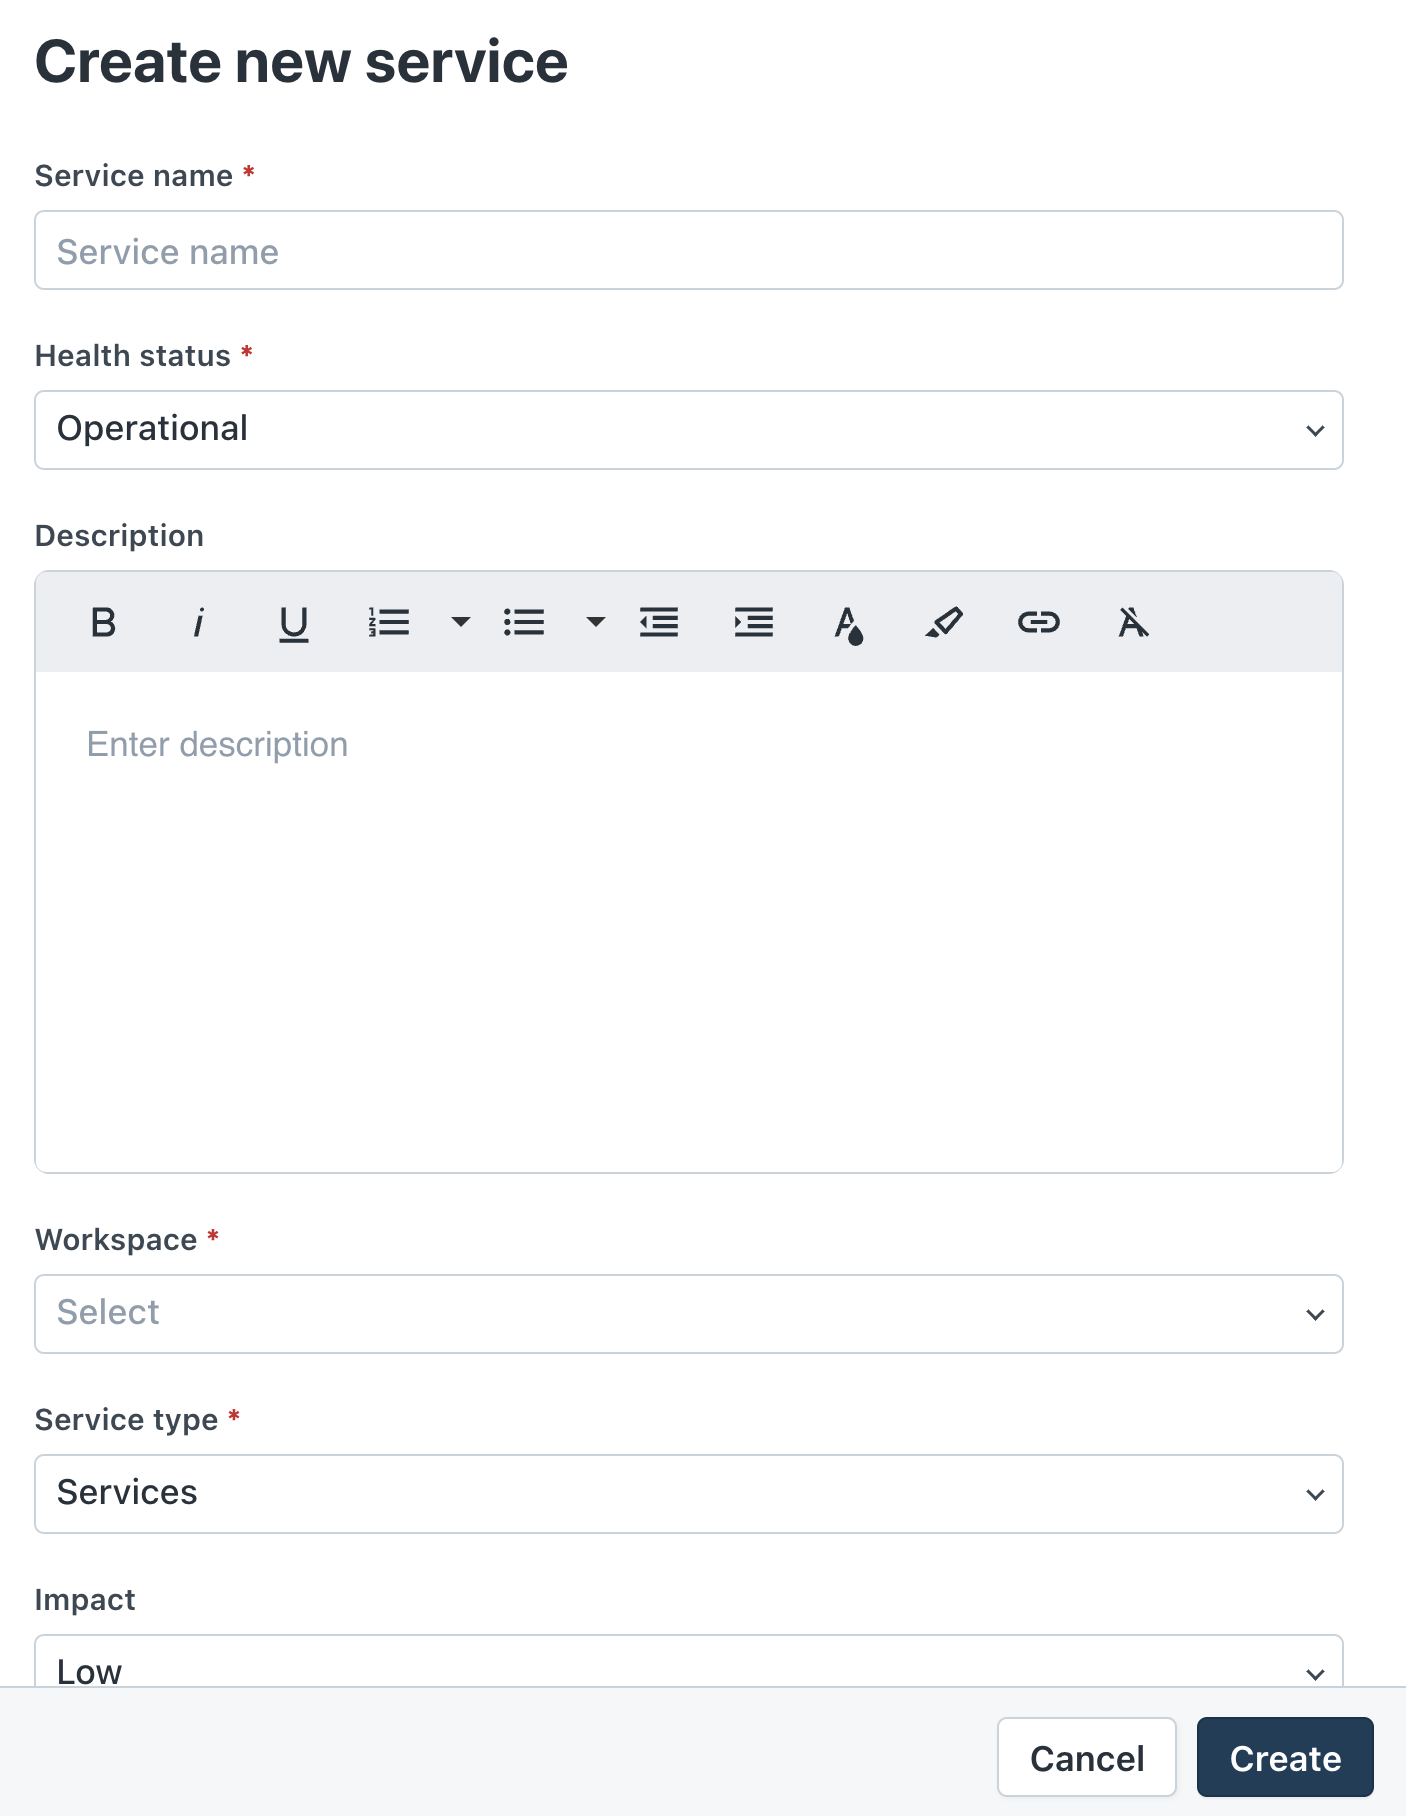
Enter relevant information about the new service in the form that pops up from the right side of the screen.
Give the service a name such as Payments, Checkout, etc.
Provide a description if required
Specify the service type i.e. Business or Technical
Choose the impact of the service if it were to go down
Select the agent group to be notified whenever the service goes down
Select the individual point of contact for this service
Attach relevant files if needed
You are now on the service details page. On this page you will be able to view the information you entered about the service.

Plus, you will see the following functionalities:
Relationships: Use it to map all assets powering a service
Associations: Use it to check the top five alerts and incidents associated with the service. Click on View All to view all the associated alerts and incidents.
Alert configurations: Use it to access the monitoring tools generating the alerts that define the state of the service
Activities: Use it for a timeline view of the progression of events related to the service
On-call details: Use it to check the on-call agent group associated with the service
To start monitoring the state of a service, you need to associate it with the monitoring tools generating the alerts that convey the state of the assets related to that service. Until you map one or more monitoring tools to a service, the tool will prompt you to do so.
Once you associate the monitoring tools with the service, you’ll see the top 5 alerts and incidents on the service overview tab.
Note: If you are mapping the service to a new monitoring tool, follow the setup instructions in this article.
Associating a monitoring tool with one or more services
You can also create a service through the Alert Management module by associating a monitoring tool with a new or existing service.
In the Admin pane, scroll down to the IT Operations Management section and click on Monitoring Tools. If your account has more than one workspace, navigate to Admin > {Worskpace Name} > IT Operations Management > Monitoring Tools.
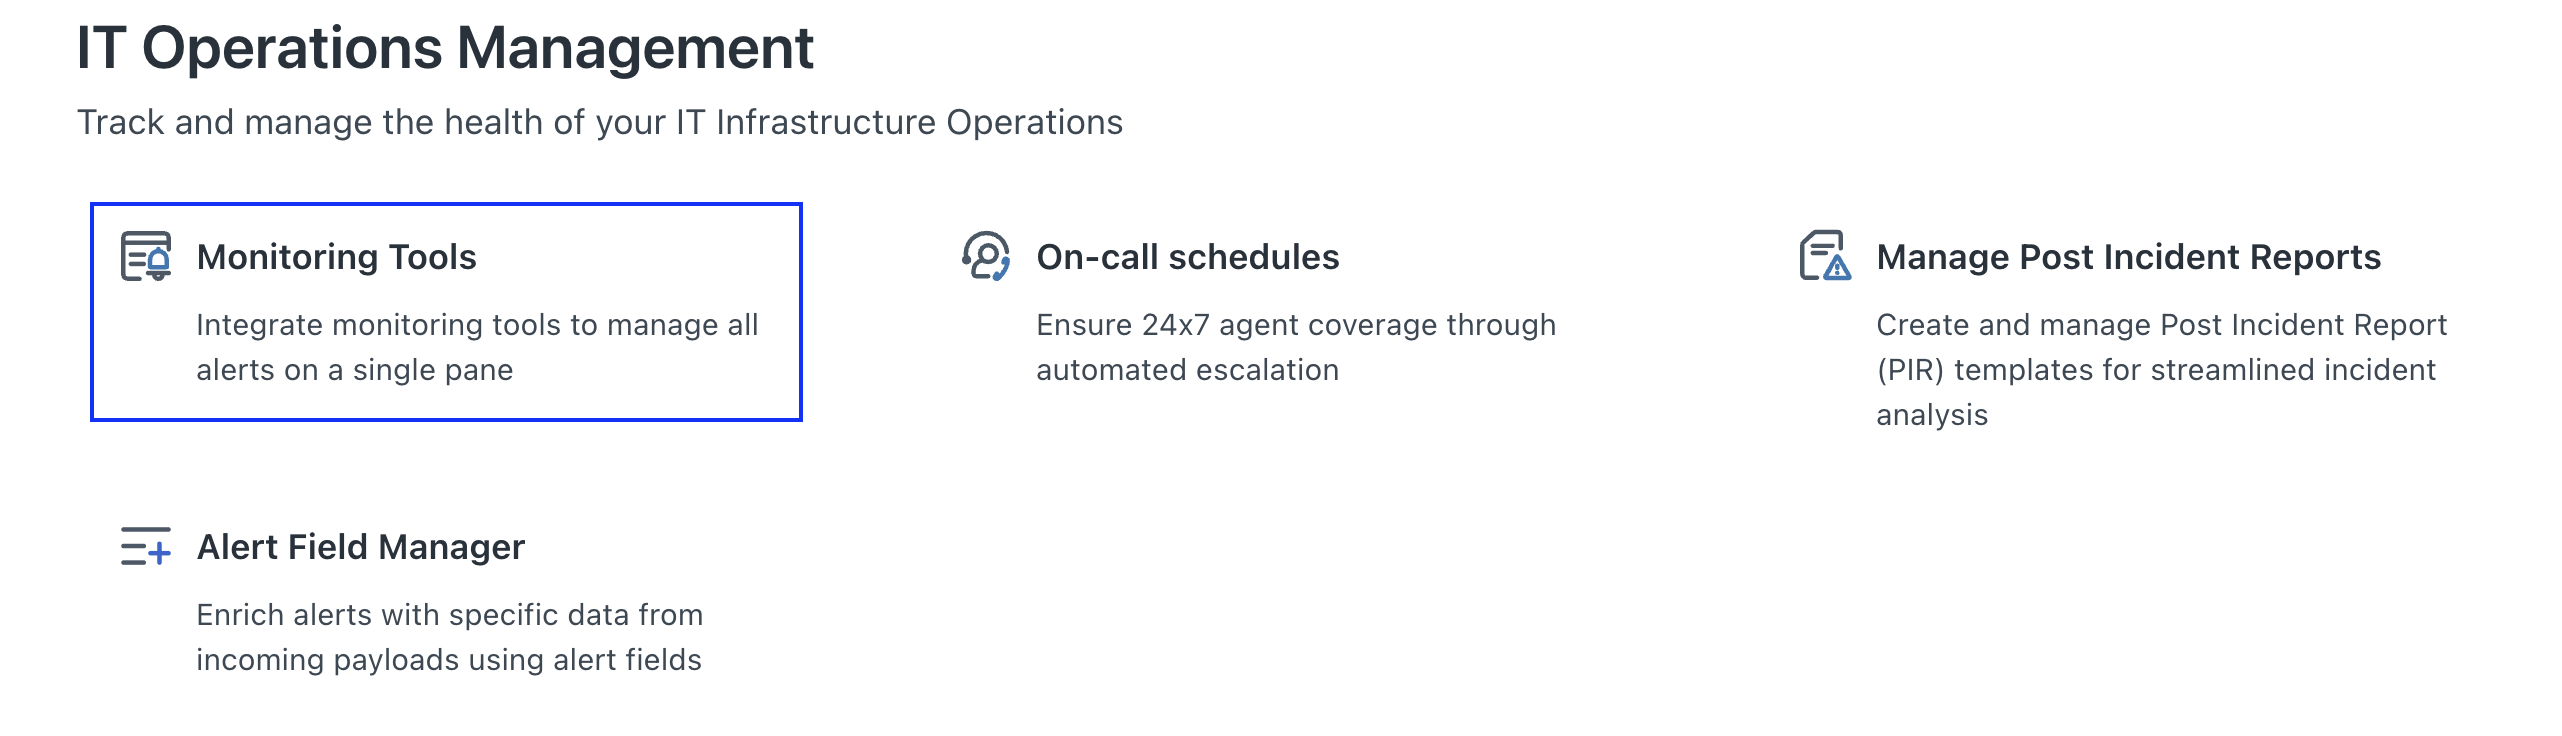
Click + Add monitoring tool.
The Monitoring tools page appears and lists all the monitoring tools available to integrate.Select the monitoring tool you want to associate with a service.
 After you select a monitoring tool, the Monitoring tool page appears and shows the tool you have selected.
Click Map to a service link or Map integration to service icon.
 The Associate a service with this monitoring tool section appears.
Select whether you want to map the monitoring tool to a single service or multiple services.
Mapping a monitoring tool to a single service
If you want to map the monitoring tool to a single pre-existing service:
Start typing out the name of the service in the text box
The tool provides a dropdown listing services that match your search query
Choose the service you want to associate the monitoring tool with
The fields 'Managed by Group' and 'Managed By' will be self populated with details entered while creating that service
Click Save
If you want to map the monitoring tool to a new service:
Start typing out the name of the new service you want to create, in the text box
If it is unique string that doesn't match existing service names, the tool will offer a +create option in the dropdown
Select +create to create the new service
Click Save
Mapping a monitoring tool to multiple services
Select Integration monitors multiple services or network infrastructure.
Choose a payload attribute that will help you identify the service. Use the + button to select the alert field to track
You can also specify the regex expression to extract the service name from the attribute. This step is optional. You can use any online tool available for free to validate your regular expressions and get more information about them. Some of them are listed below:
Save this configuration
Potential Services
Once you map a monitoring tool to multiple services, Freshservice evaluates alerts received in the Alert Management module to see if they qualify to be associated with a service. If they do, Freshservice will inform you through a banner on the Services List page. You could access these recommendations by clicking on the Potential Services button.

You can then review the candidates recommended by Freshservice, and then approve or dismiss the suggestion.

Start typing out the name of the service in the text box
The tool provides a dropdown listing services that match your search query
Choose the service you want to associate the monitoring tool with
The fields 'Managed by Group' and 'Managed By' will be self populated with details entered while creating that service
Click Save
Start typing out the name of the new service you want to create, in the text box
If it is unique string that doesn't match existing service names, the tool will offer a +create option in the dropdown
Select +create to create the new service
Click Save
Select Integration monitors multiple services or network infrastructure.
Choose a payload attribute that will help you identify the service. Use the + button to select the alert field to track
You can also specify the regex expression to extract the service name from the attribute. This step is optional. You can use any online tool available for free to validate your regular expressions and get more information about them. Some of them are listed below:
Save this configuration
Deleting a service
To delete a service, visit the Service list page and:
- Click on the service you want to delete
- On the service details page, click on the three dots icon on the top right, and click Delete
- A slider will inform you about the integrations that would be delinked from the service.
- Review your decision and confirm
Note: Deleted services are moved to Trash and can be retrieved within 90 days of deletion. You can also permanently delete services from the Trash. However, on permanent deletion, the service and all its associated information will become irretrievable.

Functionalities that you can make use of
Tabs on the Service details page

The service detail page has a number of features you could make use of. In addition to the overview tab, you'll notice several more tabs. See associated assets under the Relationships tab, associated alerts and incidents under the Associations tab, all the monitoring tools associated with this service under the Alert Configurations tab, and a timeline of the activities performed on on the service under the Activities tab.

2. Right side pane on the service details page
This would provide you with a quick view into
- Service Properties
- Impact
- Managed by group
- Managed by (primary poc)
- Primary on-call (with an option to view all on-call members)
3. Service map page
Use it to visualize multi level dependencies between impacted resources and click-through to related alerts and incidents.


3. Services List Page
This provides a single pane view of all services including:
- Service name
- Health status
- Type
- Impact
- Managed by Group
- Managed by (primary poc)

Use the Settings icon to customize this view as per your requirements.

Use the Filter icon to select filters and quickly find the service you are looking for.
